Relationship Between Temperature, Humidity and Air Quality Index
| ✅ Paper Type: Free Essay | ✅ Subject: Sciences |
| ✅ Wordcount: 906 words | ✅ Published: 12 Sep 2017 |
Abstract
This is a study about the relationship between temperature and humidity and air quality in Suzhou and Jinan. A hypothesis was formed that higher temperature and humidity can result in better air quality. The data was collected daily from May 12th to May 30th. Using simple linear regression model, the study found no significant correlation between these three variables in either Suzhou or Jinan.
Introduction
Air pollution today is becoming an increasingly serious issue in China. As incomes rise and priorities shift away from only pursuing money to ensuring a better life, environmental awareness is also soaring. So more and more attention has been paid to what affects air quality. This study tried to find the relationship between air quality and weather elements—humidity and temperature. Considering that high near-ground temperature will accelerate vertical air convection, which will dramatically reduce near-ground pollutants, a hypothesis was formed that: the higher the temperature, the better the air quality. Another hypothesis was that higher humidity will cause better air quality, which is based on the fact that droplets in the air can combine solid particles like PM 2.5 to reduce air suspension.

This study assessed the effect of humidity and temperature on air quality, in which humidity refers to relative humidity, expressed as a percent. The unit of temperature is „ƒ. AQI is short of Air Quality Index, which is calculated from five major air pollutants: O3, CO, SO2, NO2, and PM2.5. Higher AQI value means a greater level of air pollution and greater health concern,which is shown as follows:
|
AQI |
0-50 |
51-100 |
101-150 |
151-200 |
201-300 |
|
Levels of air pollution |
good |
moderate |
Slightly-polluted |
Moderately-polluted |
Heavily-polluted |
Suzhou and Jinan were involved in this study. Suzhou, a major city located in southeastern Jiangsu Province, has a monsoon-influenced humid subtropical climate . As the capital of Shandong Province, Jinan has a warm temperate continental monsoon climate with four distinct seasons. These two cities were chosen because they have similar climate except Suzhou is more humid. Thus they can be compared to obtain more reliable data.
Sampling methods and schedule of data collection are presented in “Method” section. Tables and graphs are showed in “Results” part. ” Discussion” part is the explanation of the data. A summary with recommendation of improvement follows in “Conclusion” part.
Methods
The data, containing the value of humidity, temperature and AQI, were collected daily at 3PM-4PM from May 12th to May 30th. To make it more representative and reliable, the data was collected in two cities and from two different sources: www.nmc.cn ( the website of National Meteorological Center ) and Moji APP. The final data was collected after comparing these two sources.
Results
The data contains three variables from two cities, and is 19 days in total, from May 12th to May 30th. The data collection efforts was effectively carried out, and missing values were minimal (below 5%). Graphs and tables are shown as follows:
figure 1: AQI VS temperature in Suzhou
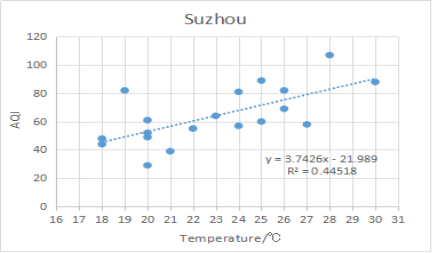
figure 2: AQI VS temperature in Jinan
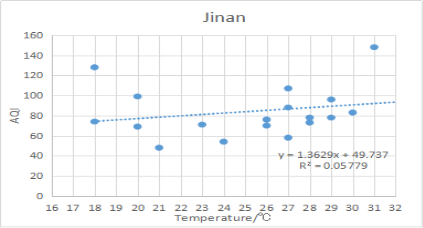
figure 3: AQI VS humidity in Suzhou
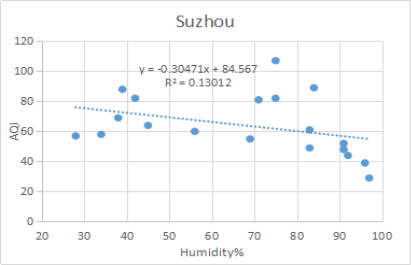
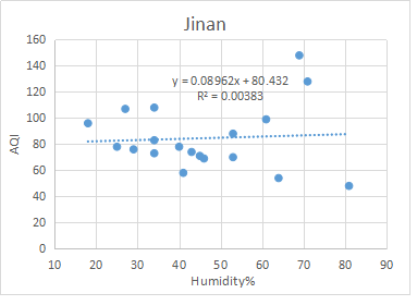
figure 4: AQI VS humidity in Jinan
Based on the analysis of simple linear regression, the relationship between variables are revealed by regression equations, which are shown in the figures. R² is also presented to show how well the points fits. Note that figure 1 fits well except points (19„ƒ,107) and (28„ƒ,107), which is probably due to the low humidity on those two days. The peak value of AQI appeared in May 25th in Suzhou with 28„ƒ and humidity of 75%. For Jinan, the peak value lies in May 27th, with 18„ƒ and humidity of 71%.
Discussion
Figure 1 presents the relationship between temperature and AQI in Suzhou. Though not significant, this figure does suggest a positive correlation between these two variables. In other words, the higher the temperature, the worse the air quality, which contradicts the first hypothesis: higher temperature causes better air quality., As shown, most of the points fit well except for the two outliers as mentioned in last part, which pull down the value of R². While figure 2 shows no correlation between temperature and AQI in Jinan with R² less than 0.1. Maybe this is because the human factor is more significant in Jinan .
As for humidity, there are no correlation in either figure 3 or figure 4, with R²=0.13012 in Suzhou and 0.00383 in Jinan. As humidity gets greater, the value of AQI hardly changes or changes irregularly, which suggests that the second hypothesis is also wrong. There is no relationship between humidity and AQI.
Conclusion
To conclude, there’s no significant relationship between temperature and AQI. Although AQI turns higher as temperature goes up in Suzhou, the correlation is not so significant. Neither in Suzhou nor Jinan were the relationship found between humidity and AQI. This is because air quality is the result of combined effects of multi-factors, so it’s very hard to figure out the effects of a single variable.
Limitations exist because the size of sample is too small. Bias is possible as the data was collected in two big cities, in which human factors are very significant, and thus rural area and other small cities are excluded in this research. I recommend that further research should collect abundant data and choose more representative cities or countries. Furthermore, if conditions allow, future researcher had better singularize the variable when analyzing how a specific variable affect air quality.
References
The Website of National Meteorological Center. ( May, 2016). http://www.nmc.cn/.
Moji Weather.(May, 2016). Moji Fengyun science and technology company.
Appendix
original data
![GU0IR)_I0LF988M_{0O7]{R](https://aaimagestore.s3.amazonaws.com/july2017/0013443.005.png)
Cite This Work
To export a reference to this article please select a referencing stye below:
Related Services
View all


DMCA / Removal Request
If you are the original writer of this essay and no longer wish to have your work published on UKEssays.com then please click the following link to email our support team:
Request essay removalRelated Services
Our academic writing and marking services can help you!
Freelance Writing Jobs
Looking for a flexible role?
Do you have a 2:1 degree or higher?
Study Resources
Free resources to assist you with your university studies!