Study of Gamma Spectrum of Cesium Isotope at 662Kev
| ✅ Paper Type: Free Essay | ✅ Subject: Sciences |
| ✅ Wordcount: 2236 words | ✅ Published: 18 May 2020 |
Detector Resolution
Abstract: As Gamma rays are the highest-energy form of electromagnetic radiation, the study of the energy spectra of gamma-ray sources, is of high importance in the fields of nuclear medicine, the nuclear industry and astrophysics. Radioactive sources produce gamma-ray in various energies and intensities. Gamma-ray energy spectrum is produced when these emissions are detected and analysed with a spectroscopy system. In this experiment, the gamma spectrum of the cesium
isotope at 662Kev was studied. Operating in a pulse mode, the characteristics and performances of a scintillation detector, Sodium Iodide (NaI(Tl)) using both Single Channel Analyzer and Multichannel Analyzer and semiconductor detector, Germanium (Ge), were detected and analyzed. Using the slope method, the energy resolution of each were measured and compared. With .68%, Germanium detector showed a higher energy resolution than NaI(Tl) detector using (MCA) and (MCA) configurations.

Introduction
There are many types of radiation detectors applied to radiation spectroscopy; however, not all of them are suitable to detect gamma-rays. For example, the efficiencies for gamma radiation using gas-filled ionisation detectors are very poor because the chances of gamma-ray photons interacting with the gas are quite small. Therefore, scientists are using solid detectors to study gamma-ray radiation. The most commonly used detector types are scintillation and semiconductor.

-
 Scintillation detectors: Different types of detectors use different methods of recording the response of gamma-ray radiation. One standard method of converting the energy of the gamma-ray’s photons is called scintillation, which involves turning the energy into visible light. Scintillation detectors use either organic materials such as plastic or some inorganic crystals such as Alkali Halide Scintillators. One of the most commonly used Alkali Halide scintillators is crystalline sodium iodide, known as NaI(Tl), in which a trace of thallium iodide had been added in the melt.
- Semiconductor Diode Detectors: The other standard method, used by solid-state semiconductors, creates electron-hole pairs that convert the energy of gamma rays into electricity. These detectors use significantly different materials and hardware compared to scintillation detectors. The most commonly used material is Germanium (Ge).
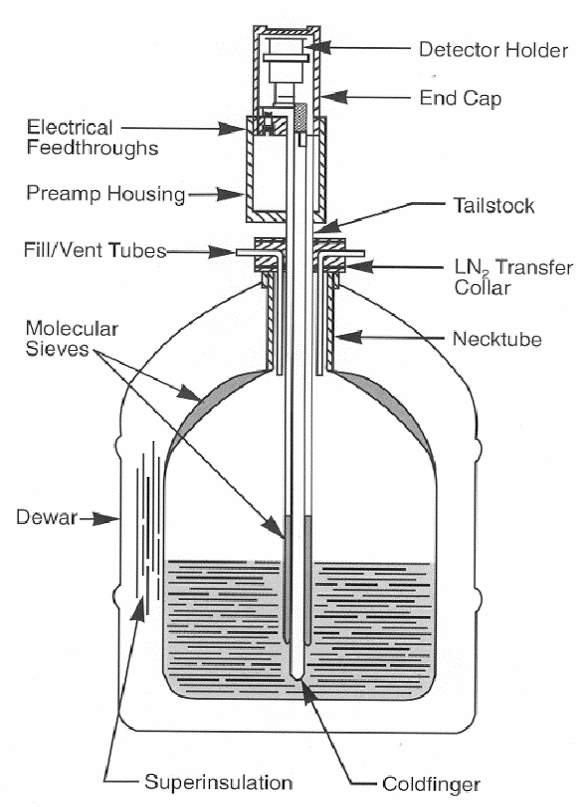
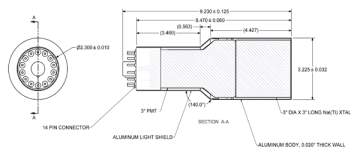
Germanium Detector Configuring
There are many general properties of detectors when applied to study gamma-ray spectroscopy. However, the most important two are energy resolution and efficiency. The focus of this study was on the energy resolution.
Energy Resolution: is an essential parameter in determining the overall performance of a detector.There is no system capable of detecting the exact energy of gamma photons. Instead, the detectors can measure a range of energy values which are presented as peaks in the spectrum. The energy resolution is the percentage of the full width at half maximum (FWHM) of a given energy peak to the peak Hight.
The energy resolution is given by the function R
Where,
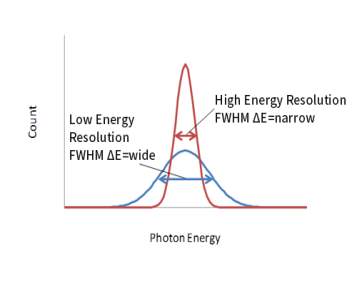
Figure (2): Resolution of the detector is directly proportional to width of the peaks. The lower the resolution of the detector the wider FWHM of the peak
= the full width at half maximum of the full-energy peak
= is the centroid peak number (mean pulse height corresponding to the same peak) fig (1).
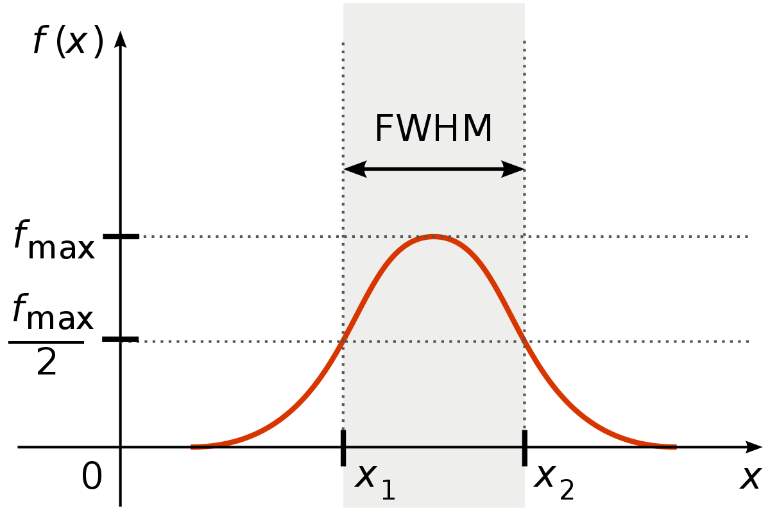

Figure (1): Full Width Half Maximum of a peak between two points x1 and x2
The smaller the width of the pulse, the higher the resolution of the detector. When there is a large amount of fluctuation recorded, the peak becomes more extensive, and thus, the resolution of the detector is considered weak [1].
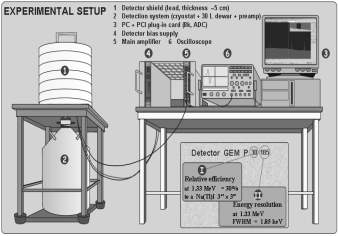
Materials
- NIM Bin and Power Supply
- NaI(Tl) Crystal and Phototube Assembly
- Germanium Detector
- High Voltage Power Supply
- Preamplifier
- Amplifier (Ortec model 572)
- Pulse Generator
-
gamma-ray source
- Counter/Timer
- Cathode-ray Oscilloscope (CRO)
- Multi-Channel Analyzer
- Single Channel Analyzer
Experiment Setup
 Electronic setup for Nal detector with Single Channel Analyzer:
- Electronic setup for Nal detector with Multi-Channel Analyzer:
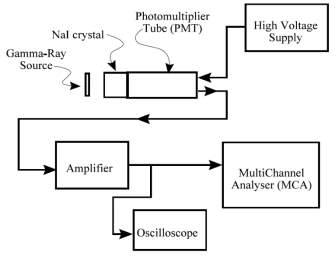
Figur3.2: NaI Detector and MCA Configuration
-
 Electronic setup for Germanium detector with Multi-Channel Analyzer:
Methods
Part 1, SCA measurements for Nal(Tl)
- The source was placed 3-5 cm in front of the Nal(Tl) detector crystal (the source-detector distance kept the same through the experiment so it does not affect the count rate).
- The amplifier unipolar output pulses were observed with the CRO.
- The pre-amplifier output pulses were observed and sketched.
- The CRO settings were then recorded.
-
The coarse and fine gain controls of the amplifier were adjusted so that the 662 keV photopeak (the most intense pulses) for
is approx. 7.0 V on the CRO.
- The channel width of the SCA was set to 0.2 V and the baseline to just below the photopeak amplitude (Vp – 0.1)
- the baseline was set to 9.8 V and was counted for time 10 sec. (pulses between 9.8 and 10.0 V) then was repeated at 0.2 V intervals down to zero volts.
- The background counts were counted by removing the source (counting at 1 V intervals on the SCA with a window width of 1.0 V for time T) these values
were then divided by 5 and subtracted from the counts obtained in step 7.
Part 2 and 3, MCA measurements for Nal (Tl) and Ge Detectors
- By using the same setup for part 1, the SCA and the amplifier were disconnected and reconnected the amplifier to MCA, as shown in Figure 3.2, 3.3.
- The MCA was calibrated with appropriate calibration source.
-
The
spectrum
was accumulated for the same amount of time that was used in step7. The ROI was set around the main photopeak and a peak report was obtained. - The data was then saved to be used to analyse the result.
-
The
spectrum was obtained from a Germanium detector by repeating steps 10 to 12.
Results and Discussion
 Part (1) The resolution of the Nal detector using SCA
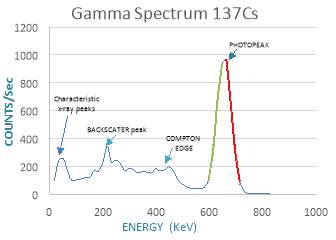
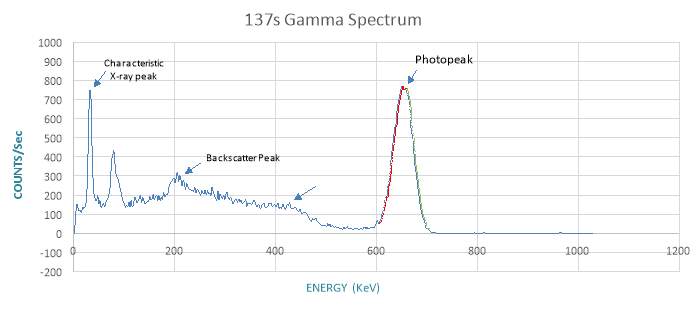
Graph 1: 137Cs gamma ray spectrum using NaI(TI) detector with (SCA) single channel analyser
Graph 1 shows the different peaks associated with the gamma spectrum. The highest peak, where the maximum counts 967.6 were recorded, was at energy 662KeV and is identified as the Photopeak. Another
visible peak is the Back-scatter peak, which can be at the energy level of approximately 215 KeV. Approximately
between 281.35 and 446.85 Compton continuum can be found. To calculate the detector resolution, equation 1
= 662 which is the energy of 137Cs gamma rays at the Photopeak.
Maximum of the peak = 967.6 = y
 Half maximum of the peak = 483.6
From the equations of the slopes in the chart and by using the equation of a Straight Line the values of
were calculated:
FWHM= 688.10-619.25= 68.847
By plotting these values in equation 1:
The resolution of the Nal detector using SCA is
Part (2) The resolution of the Nal detector using MCA
Compton Edge
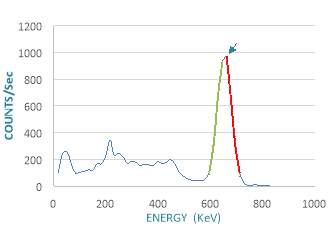
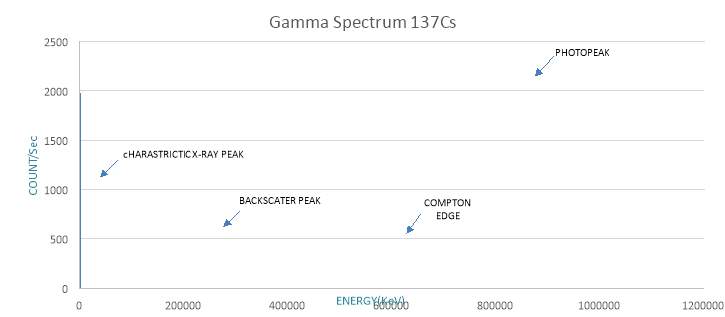
Graph 2: 137Cs gamma ray spectrum using NaI(TI) detector with (MCA) multi-channel analyser
Graph 2 shows a Cesium 137 gamma-ray spectrum using Nal(Tl) detector and a multichannel analyser. The readings of More than 450 channels had been collected as it is more convinance with the MCA to take multiple readings in such a short time, unlike SCA. There are a few significant peaks that are of interest in this study. The Photopeak was at channel 289, where the energy reaches 662KeV. Characteristic x-ray peak and backscatter peak are visible at 210 and 302 respectively. The counts level fluctuates slightly after that and reaches Compton edge at approximately 432Kev, followed by a decline before reaching the photopeak at the highest value of counts.
To calculate the detector resolution, equation 1
= 662 which is the energy of 137Cs gamma rays at the Photopeak.
Maximum of the peak = 757 =
Half maximum of the peak = 378.5 = y
From the equations of the slopes in the chart and by using the equation of a Straight Line the values of
were calculated:
FWHM= 680.539 – 631.214= 49.325
By plotting these values in equation 1:
The resolution of the Nal detector using SCA is
Part (3) The resolution of the Germanium detector using MCA
Graph (3): 137Cs gamma ray spectrum using Germanium detector with (MCA) multi-channel analyser
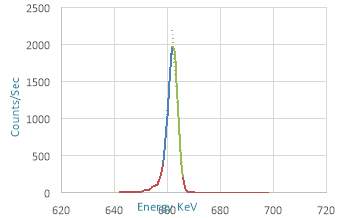 Chart 3 shows two sharp peaks at both ends of the spectrum. The first one is the x-ray peak at 31.185 Kev. The other sharp peak is the photopeak at 662 KeV where the count reaches its highest before dropping sharply to zero. Another significant peak is the backscatter peak at 366.849 KeV and 69 counts. It was followed by Compton continuum up to 485.9 where it reaches Compton edge and declines.
To calculate the detector resolution, equation 1
= 662 which is the energy of 137Cs gamma rays at the Photopeak.
Maximum of the peak = 757 =
Half maximum of the peak = 378.5 = y
From the equations of the slopes in the chart and by using the equation of a Straight Line the values of
were calculated:
= 664.124 – 659.614
= 4.51
By plotting these values in the equation, the resolution of the Nal detector using SCA is
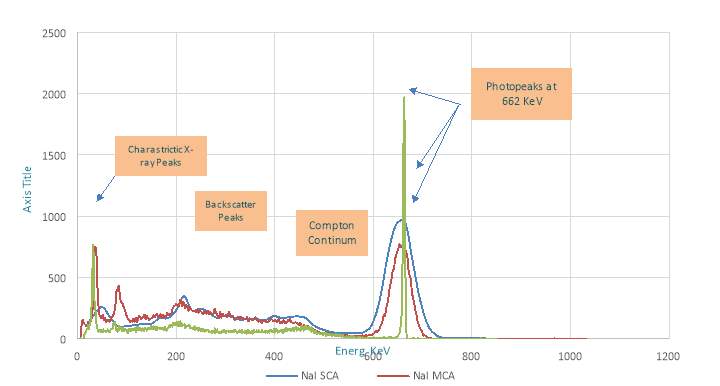


Graph (4): the combined 137Cs gamma-ray spectrum using Nal(TI) detector with single channel analyser (SCA) and multichannel analyzer (MCA) and Germanium detector with multichannel analyser (MCA)
Graph 4 shows all the result from the three parts of the experiment plotted together. The spectrum results follow the same rhythm in all of them. Characteristic x-ray peaks followed by backscatter peaks then a small amount of fluctuations during Compton continuum which last between 250KeV and 450Kev before reaching Compton edge and the values of the counts drop. Photopeaks with the highest counts are reached at 662 KeV in all of them then the counts drop to zero, and the spectrum reaches a flat line. Resolution of the detector is directly proportional to the width of the peaks. The lower the resolution of the detector, the wider FWHM of the peak as it shown in the photopeaks measured using Nal detector. In contrast, the photopeak detected by Germanium is narrow and thus, the resolution is high.
Uncertainties
The uncertainties in the results were calculated by running the regression function on the collected data in Excel. From the regression, the change in the slope,m and the change in the intercept c, were used to calculate the following:
=
=
By taking percentage relative uncertainty
)
100= 7.5%
100 =7%
=
= 619.2
14.5% = 619.2
149.64 KeV
=
=
=
(
)
100= 6.6%
100 =7.3%
=
= 619.2
14.5% = 619.2
149.64 KeV
- Uncertainties in the calculation of x1, x2 and in part (2):
=
=
By taking percentage relative uncertainty
(
)
100= .4%
100 =3.8%
=
= 631.2
4.2%
=
=
=
(
)
100= 4.8%
100 =4.8%
=
= 680.5
9.6%
Uncertainties in the calculation of x1, x2 in part (3):
=
=
By taking percentage relative uncertainty
(
)
100= 3.6%
100 =3.6%
=
= 659.6
7.3%
=
=
=
(
)
100= 7.6%
100 =7.6%
=
= 664.1
15.3%
Conclusion
In conclusion, in this study, the performance of Nal(TI) using SCA and MCA and a germanium Ge detector were compared. From the result using a multichannel analyser with Nal detector showed a better resolution than using Nal with single channel analyser. However, the germanium detector delivers the best resolution compared with that measured by Nal detector using single channel analyser and multichannel analyser, which shows its ability to resolve located peaks accurately. The resolution for Ge was
which is very high resolution compared with
and 10.4 % for Nal(TI) using MCA and SCA respectively. Though, despite the fact that, Nal detectors do not deliver the best resolution, they are considered the best choice in detecting radiation due to the due to their high detection efficiency and the fact that they operate at room temperature. The size of Germanium detectors and the need for liquid nitrogen to cool them make them unideal as a first choice despite the high resolution they present. So, up until the development of mechanically refrigerated germanium detectors takes shape, the practicality of Nal detectors will keep them attractive for field applications.
References
- Ross W.A. (1973) Multichannel Analyzers. In: Krugers J. (eds) Instrumentation in Applied Nuclear Chemistry. Springer, Boston, MA
- Milam J.K. (1973) Single-Channel Analyzers. In: Krugers J. (eds) Instrumentation in Applied Nuclear Chemistry. Springer, Boston, MA
- Knoll, G. F. (2010). Radiation Detection and Measurement, 4th Edition (4th ed. ed.). New York: Wiley.
- Ortec An34 Experiment 3 – Math.temple.edu. (n.d.). Retrieved from https://math.temple.edu/~cmartoff/teaching/ph4796_10/NaI/AN34_exp03.pdf
Cite This Work
To export a reference to this article please select a referencing stye below:
Related Services
View all


DMCA / Removal Request
If you are the original writer of this essay and no longer wish to have your work published on UKEssays.com then please click the following link to email our support team:
Request essay removal