Monochromatic and Dichromatic Light Wavelength Measurement
| ✅ Paper Type: Free Essay | ✅ Subject: Physics |
| ✅ Wordcount: 2396 words | ✅ Published: 09 Mar 2018 |
Monochromatic and Dichromatic Light Wavelength Measurement using Michelson Interferometer
- Alireza Safaripour[1]
The current paper studies the theory, operation and applications of Michelson interferometer. After the introduction of the working concepts of the interferometer, the theory behind measuring the wavelength of monochromatic and dichromatic light using this interferometer is presented as two samples of its application. Furthermore, these measurements are performed on a simple Michelson interferometer using a Mercury lamp as the monochromatic light source and a Sodium lamp as the dichromatic one, and the results are compared to the actual values. The sources of errors are introduced and analyzed and finally, some sample results of Michelson interferometer are compared with the equivalent ones from Fabry-Perot interferometer.
Keywords: Michelson Interferometer, Interference, Monochromatic Light, Dichromatic light, Wavelength Measurement,
PACS: 95.55.Sh, 93.90.+y, 13.15.+g
- Introduction
Interferometers are basic optical tools used to precisely measure wavelength, distance, index of refraction, and temporal coherence of optical beams. The Michelson interferometer causes interference by splitting a beam of light into two parts. Each part is made to travel a different path and brought back together where they interfere according to their path length difference.
The Michelson interferometer, developed by Albert Michelson in 1881, the first American to win a Nobel Prize for science, is one of the best known of optical instruments used by physicists and astronomers [1]. It was developed to measure the standard meter in units of the wavelength of the red line in the cadmium spectrum [2]. Some of the parameters that can be measured using this instrument are: 1) the wavelength of a light source, 2) the index of refraction of a material, 3) the width of a spectral line, and 4) the Earth’s motion through the “aether”. The last item refers to the Michelson-Morley experiment, a failed attempt to demonstrate the effect of the hypothetical “aether wind” on the speed of light, which along with other experiments, showed that ether does not exist and that electromagnetic waves can propagate in a vacuum [3]. Their experiment left theories of light based on the existence of an aether without experimental support, and served ultimately as an inspiration for special relativity [4]. Michelson interferometer has also been used in Fourier transform spectroscopy, detection of gravitational waves and as a narrow band filter.
 The current paper first goes over the working principals and background theory of the Michelson interferometer and as a sample of its application, some details regarding wavelength measurements are explained. In the next sections, the procedure and results of monochromatic and dichromatic light wavelength measurement performed by the author in Optics Laboratory of Department of Physics and Astronomy at Michigan State University are presented and discussed.
- Theory
A simplified diagram of a Michelson interferometer is shown in the FIG. 1.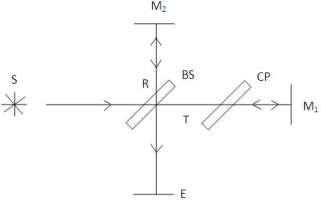 Light rays coming from a monochromatic source S are incident with a 45° angle on a beam splitter (BS) and produces two beams of equal intensity. The transmitted fraction of the beam (T) travels to mirror M1 and reflects back to BS. Half of this incoming beam is again reflected by BS and hits the screen, E. The reflected half of the original beam (R) reflects from mirror M2, and likewise, half of this ray goes through BS and reaches the screen.
It is worth mentioning that since the beam splitter reflects the beams from its farther surface from the source, the portion of the rays that reflect from M2 passes through the BS three times, while the lights going towards M1 only pass through BS once. This difference can cause an unwanted optical path difference between the two rays, and to compensate for this effect, a glass surface of the same thickness and index of refraction (CP) is placed between M1 and BS. The two portions of the original beam meet at the surface and their interference produces interference fringes at the screen. The angles of M1 and M2 can be adjusted to create circular, curved or straight fringes.
As shown in FIG. 2, looking at the screen, one beam comes from M2 and another beam seems to come from the virtual image of M1, which can be called M1‘. When there is a difference between the distances of the two mirrors, there would appear to be the same distance, d, between M1‘ and M2. Considering a beam coming from a source point S, the reflections form M1‘ and M2 appear to come from the points S1 and S2 respectively. The optical path difference between these two points can be found to be: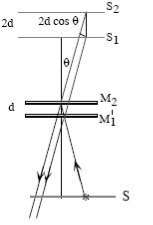
|
|
(1) |

where Δx is the optical path difference, d the distance between the two mirrors and θ the angle of observation.
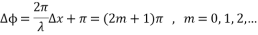
When the light that comes from M1 undergoes reflection at BS, a phase change of π occurs, which corresponds to an additional phase difference of π. Therefore, the total phase difference between the two beams is
|
|
(2) |
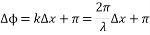
 where ΔÏ• is the phase difference, k the wavenumber and λ the wavelength of the light.
The condition for destructive interference or dark fringes is then
|
|
(3) |
|
|
(4) |
|
|
(5) |
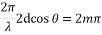

When the mirror separation and light wavelength remain constant, for a specific order m, the angle of inclination stays constant which results in circular fringes that are called fringes of equal inclination, or Haidinger fringes. If the two mirrors have the same distance from the beam splitter, the phase difference between the interfering beams will be equal to π because of the phase change due to reflection, and this causes destructive interference or dark fringes at the center of the field.

According to equation (5), an increase in the separation distance of the mirrors, results in new rings appearing from the center at a faster rate the rings going out of the field of view, and this makes the field of view more crowded and the rings become thinner as they go outward. Similarly, when the separation is decreased the rings appear to move towards the center and as they do, they become wider and sparser. Since appearance or disappearance of a fringe means that a distance of λ/2 has been moved, if the mirror is moved a distance d, and the number of fringes that appear or disappear is counted, N, the wavelength of the light can be found.
|
|
(6) |

Considering the case for when there are two wavelengths, λ1 and λ2 present in a dichromatic light source, the two interference patterns are dictated by equation (5) and are superimposed at the detector. The maxima in the combined interference patterns then, occur at displacements when each separate interference pattern is maximized, that is, when the optical path difference is an integer multiple of both λ1 and λ2. The minima of the combined interference patterns occur directly between the maxima for symmetry reasons. Supposing d1 is a displacement which gives maximal (or minimal) fringe visibility in the field of view, then the next displacement which gives maximal fringe visibility occurs when
|
|
(7) |
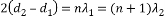
for some integer n. In words, it is required that the shorter wavelength wave shift one fringe more than the more slowly varying long wavelength in the course of a full period of beats. This can be solved for n as
|
|
(8) |

and subsequent substitution of equation (8) back into equation (7) gives
|
|
(9) |
By donating λave as the average wavelength, if the wavelength separation is small, the small quantities ϵ and δ are defined [5]
|
|
(10) |
|
|
(11) |


Assuming the intensities of the two wavelengths are equal
|
|
(12) |

Then,
|
|
(13) |

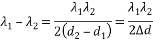
And finally
|
|
(14) |

This gives a way of determining the wavelength separation given the average of the wavelength. If it is assumed that the intensities are approximately the same, then the average is centered between λ1 and λ2.
- Procedure
A schematic of the experimental setup is presented in Fig. 3.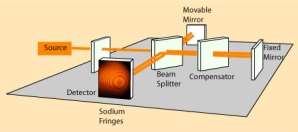
 The first light source of the experiment was a Mercury lamp with a wavelength of 546.1 nm and a green color. The angle of the stationary mirror was constantly adjusted during the experiment to ensure that the center point was in the field of view.
In the first part of the experiment it was attempted to measure the wavelength of the green light produced by the mercury lamp. In order to do that, the movable mirror was slowly moved from a starting position and the number of fringes coming in or going out was counted. The position where the 50th fringe was counted was recorded as the distance d and equation (6) was used to estimate the wavelength of the light. It was noted that the micrometer was attached to a 5:1 lever which meant that the readings of the micrometer should be divided by 5 to show the actual displacement of the mirror. Since the accuracy of the micrometer was 5 micrometers, the accuracy of displacement readings was 1 micrometer.
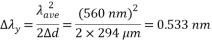
As the last part of the experiment a yellow Sodium lamp was used that emitted two very closely spaced yellow lines at 589.0 nm and 589.6 nm. A similar procedure to the Hg lamp was used to estimate the average wavelength of the light by counting 50 fringes and measuring the distance. The beating phenomenon resulting from these two close wavelengths were observed and the distance between two consecutive minima points (where the fringes were very blurry an almost unrecognizable) was measured. The number of fringes that would happen during this distance was estimated by extrapolating the distance that the 50 fringes were measured for and equations (8) and (14) were used to calculate the difference between the two present wavelengths. The uncertainties in calculating this difference was also estimated.
- Results and Discussion
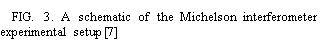
In order to measure the wavelength of the green light produced by the Hg lamp, the displacement that caused 50 fringes between them was measured. The micrometer was set at 11.00 mm as the starting point and after counting 50 fringes entering the field of view, the reading of the micrometer was 11.07 mm. Since the smallest unit of measurements was 0.01 mm or 10 µm, the uncertainty of this readings was assumed to be 5 µm. It was noted that since the micrometer was connected to the mirror through a 5:1 lever, the actual displacement of the mirror was one fifth of this reading.
|
|
(15) |
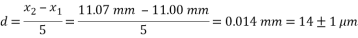
Then, equation (6) was used to calculate the wavelength
|
|
(16) |
To calculate the uncertainties
|
|
(17) |
|
|
(18) |
|
|
(19) |
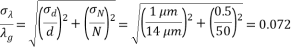

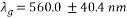
The known value of the wavelength of this green light, 546.1 nm is within the errors of this measurement and a 2.5% difference was seen between the known and measured values which is a relatively small error.
A similar procedure was carried out to measure the average wavelength of the dichromatic light. Once again, the point of 11.00 mm was selected as the starting point and after counting 50 fringes, the finishing point was again very close to 11.07 mm. Then, by applying the same calculation method the value for measured wavelength and its uncertainty were found.
|
|
(20) |
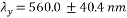
Similarly, the actual known values for this light, 589.0 nm and 589.6, are within the bounds of uncertainty and show a 5% difference from the measured value.


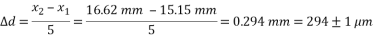
 As the next step, in order to find the difference between the two present wavelengths in the light, the distance between two minima points in the beating phenomenon was measured. The point of minima was found by looking at the fringes and choosing the point that the fringes were the least visible. The two consecutive readings from the micrometer for the minima points were 15.15 mm and 16.62 mm.
|
|
(21) |
Using equation (14) and putting the measured value for wavelength
|
|
(22) |
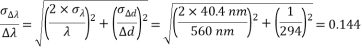
 The uncertainty in this calculation can be found from
|
|
(23) |
|
|
(24) |
|
|
(25) |

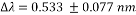
And the known value of this difference, 0.6 nm, is within the range of uncertainty.
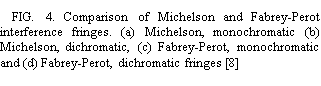
Some of the sources of error in this measurements include the accuracy of the micrometer, the backlash of the micrometer, the quality of the mirrors and their respective reflection coefficient. Another issue with the Michelson interferometer is that the width of the fringes are relatively broad and that makes this device less accurate. Using a similar concept, Fabrey and Perot introduced a new interferometric device in 1897 that could improve some of the issues observed in Michelson interferometer. Simply, in Fabrey-Perot interferometer the light passes through a pair of parallel mirrors and undergoes multiple reflection and the interference of these light rays creates highly well-defined interference fringes.
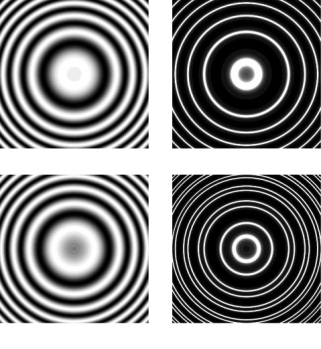
The main advantage of this new interferometer was that the fringes were significantly thinner and this meant higher accuracy in measurement and resolving ability. As an example, FIG. 4 compares the monochromatic and dichromatic fringes observed each of the Michelson and Fabrey-Perot interferometers. It is evident that the broader fringes in Michelson interferometer results in the dichromatic fringes in (b) being undistinguishable.
- Conclusions
The Michelson interferometer was investigated and its working concept and two sample applications of this device were practically examined. The wavelength of the green light produced by the Hg lamp was measured using this interferometer to be 560.0±40.4 nm which was close to the actual value of the wavelength, 546.1 nm, and with only a 2.5% difference between the experimental and known value. As another example application, the difference in the two present wavelengths in a yellow light produced by a Na lamp were measured and the beat phenomenon was observed. The difference was found to be 0.533±0.077 nm and was very close to known value of 0.6 nm.
The accuracy of the micrometer, the backlash in micrometer, the quality of the mirrors and the splitters were discussed as some of the possible sources of error in measurements. It was also pointed out the breadth of the fringes in Michelson interferometer is one of the inherent causes of limited accuracy of this interferometer. Finally some sample results from Michelson and Fabry-Perot interferometer were compared to further show the inaccuracy of Michelson interferometer in measuring two very close wavelength in a dichromatic light.
- References
|
[1] |
I. F, J. H. B, A. L. A, D. A. A and I. D. Howarth, “PHAS 2130: Practical Astrophysics,” February 2013. [Online]. Available: http://zuserver2.star.ucl.ac.uk/~idh/PHAS2130/web_scripts/Michelson.pdf. |
|
[2] |
R. W. Ellsworth, “Physics 263, Fall 2014,” 18 11 2014. [Online]. Available: http://physics.gmu.edu/~ellswort/p263/michelson.pdf. |
|
[3] |
“Moderin Physics I – Experiments and Demonstrations,” 18 11 2014. [Online]. Available: http://physics.nyu.edu/~physlab/Modern_1/MInterferometer.pdf. |
|
[4] |
Boundless, “The Michelson Interferometer,” 3 July 2014. [Online]. Available: https://www.boundless.com/physics/textbooks/boundless-physics-textbook/wave-optics-26/applications-of-wave-optics-177/the-michelson-interferometer-648-11273/. |
|
[5] |
J. Ong, “Investigations of Light with a Michelson Interferometer,” Applied & Engineering Physics, Cornell University, 2010. |
|
[6] |
“Michelson’s Interferometer- Wavelength of laser beam,” AMRITA Vishwa Vidyapeetham University, [Online]. Available: http://amrita.vlab.co.in/?sub=1&brch=189&sim=1106&cnt=1. [Accessed 28 October 2014]. |
|
[7] |
R. Nave, “HyperPhysics,” Georgia State University, 2012. [Online]. Available: http://hyperphysics.phy-astr.gsu.edu/hbase/phyopt/michel.html. [Accessed 28 October 2014]. |
|
[8] |
G. J. Gbur, “Skulls in the Stars,” 16 October 2008. [Online]. Available: http://skullsinthestars.com/2008/10/16/fabry-perot-and-their-wonderful-interferometer-1897-1899/. [Accessed 20 November 2014]. |
[1] Electronic mail: safaripo@msu.edu
[2] http://www.egr.msu.edu/me/
Cite This Work
To export a reference to this article please select a referencing stye below:
Related Services
View all


DMCA / Removal Request
If you are the original writer of this essay and no longer wish to have your work published on UKEssays.com then please click the following link to email our support team:
Request essay removal