Factors Affecting Velocity of a Sphere Rolling Down Incline
| ✅ Paper Type: Free Essay | ✅ Subject: Physics |
| ✅ Wordcount: 2888 words | ✅ Published: 15 Sep 2017 |
Factors affecting the velocity of a sphere rolling down an incline.
An experiment was performed investigating the factors affecting the velocity of a ball rolling down an incline. After investigating how mass, angle of incline, and center of mass affect the velocity of a ball rolling down an incline, it was determined that the hypotheses of “The greater the angle of the incline the ball is rolling down, the greater velocity the ball will reach.”, “The greater the mass of the ball, the greater velocity the ball will reach.”, and “The more centered the mass of the ball, the greater velocity the ball will reach.” were supported.
Lane Dederer
There are multiple factors affecting the velocity a ball gains while descending an inclined plane.
One simple factor that will affect the velocity of a ball rolling down an incline is the angle of the incline. This is due to the fact that when the angle of the incline is increased, the height of the incline also increases. Gravitational potential energy equals mass multiplied by gravity multiplied by height ( ), meaning height is one of the factors affecting the potential energy the ball possesses. The higher the angle of the incline, the faster the velocity
Another factor affecting the velocity of a ball rolling down an incline is the mass of the ball, which is also a factor in the gravitational potential energy equation.
The last factor that will be discussed is mass distribution within the ball. The velocity of a ball rolling down an inclined plane could be affected by the location of mass within the ball. For example, if the majority of the mass of a ball is located on one side, this would likely create different results compared to a ball in which mass is distributed evenly. (Hyperphysics.phy-astr.gsu.edu, 2017)
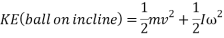
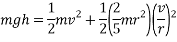
While potential energy is determined by the equation of , the actual energy produced (kinetic energy) is also dependent on rotational kinetic energy of the ball, which is represented by the equation  . In this equation,
  and
and  .
.


Gravitational potential energy
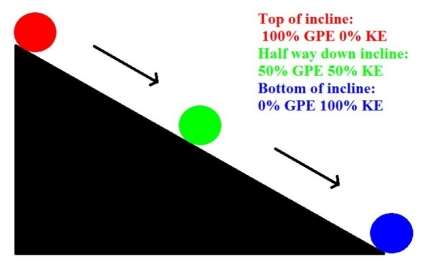
Gravitational potential energy or GPE is a type of potential energy possessed by an object due to its position in a gravitational field. (Hyperphysics.phy-astr.gsu.edu, 2017) One way to demonstrate this concept is a ball rolling down an incline. When the ball is stationary at the top of a slope, it possesses 100% gravitational energy, meaning none of its potential energy has been converted into another form of energy. When a ball rolls down an incline, its gravitational potential energy is converted into motion, or kinetic energy (KE) which will be discussed next. When the ball has travelled half way down the incline, it possesses 50% GPE and 50% KE. When the ball has travelled 75% of the distance down the incline, it possesses 75% KE and 25% GPE. When the ball has travelled 100% of the distance of the incline, it possesses 100% KE and 0% GPE. This is due to the fact that all of the ball’s GPE has been “used” or converted into KE. At this point the ball no longer possesses any potential to be put into motion unless acted on by an external force.
Gravitational potential energy can be calculated using the following formula:

Which simplified looks like the following:
This equation shows that the higher the height of an incline, the more potential energy would be possessed by an object at the top of the incline. The equation also shows that the higher the mass of an object, the more GPE it will possess. While acceleration due to gravity (g) is also a variable in the equation, as the acceleration of an object due to gravity is the same everywhere on earth. (Physicsclassroom.com, 2017)

Kinetic energy
Kinetic energy is the energy of movement, or motion. It is defined as “an object in motion possesses kinetic energy.” (Hyperphysics.phy-astr.gsu.edu, 2017) Kinetic energy can be calculated using the following equation:
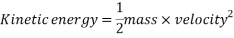
Simplified:
The equation for kinetic energy shows that it is dependent on mass and velocity. Therefore, the higher the mass of an object the more kinetic energy it possesses, and the higher the velocity of an object the more kinetic energy it possesses. (Physicsclassroom.com, 2017)

Friction
Friction is a form of resistance between two solid objects. The amount of resistance between these two solid objects is in most cases dependent on the force holding the surfaces of the two objects together, and the roughness of each surface. The formula for friction is as follows:
Where:


(Hyperphysics.phy-astr.gsu.edu, 2017), (School-for-champions.com, 2017)
The hypotheses for the experiment are as follows:
The greater the angle of the incline the ball is rolling down, the greater velocity the ball will reach.
The greater the mass of the ball, the greater velocity the ball will reach.
The more centered the mass of the ball, the greater velocity the ball will reach.
Equipment was gathered including a 1 meter long flat wooden board, 4 table tennis balls, a stopwatch, fine sand, water, a drill, adhesive tape, and a stack of textbooks. Firstly, the wooden board was placed one end touching the desk and one end supported by the textbooks, creating the incline that was used for the experiment. An opening was then drilled in 3 of the 4 table tennis balls to allow for insertion of water and sand, allowing balls of varying mass. Once the incline was at the desired angle, the ball being tested was held at the top of the incline. The first participant suspending the ball at the top of the incline gave a countdown, prompting the second participant to start a stopwatch as the ball was released. As soon as the ball reached the bottom of the incline, the stopwatch was stopped. The time provided from the stopwatch was then arranged in a table. This process was repeated three times for each angle in test one (how the angle of incline affects the velocity of a ball rolling down an incline), and five times for each angle in test two. (how mass affects the velocity of a ball rolling down an incline) As test one was not testing any variables to do with mass, it only required one ball to be used throughout the test. The sand filled ball was chosen for this as it was solid and consistent.
Angle of incline
The way the angle of the incline affected the ball’s velocity was tested by rolling the ball down an incline at angles of 5°, 10°, 15°, 20°, 25°, 30°, 35°, 40°, and 45°. Each of these increments were tested three times, ensuring accurate data. The angle of the incline was calculated using trigonometry, using the height of the incline and the length of the incline (the hypotenuse) to find the required angle. Textbooks were used to support the board at the correct height. Once the correct angle of incline was met, the ball was timed rolling down the incline 3 times for the sake of accurate data. This process was repeated for every angle being tested.
Mass of ball
The effect the mass of the ball had on velocity was investigated by testing three balls of different masses. One ball had a hole drilled in it and was filled with water (36.2 grams), one ball had a hole drilled in it and was filled with sand (52.4 grams), and one ball was left as it is (2.7 grams). Each of these balls were timed five times rolling down an incline of 20°.
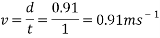
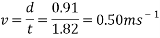
All data from the experiment was recorded on paper and arranged in a table, so it could then be graphed, allowing the data to be analysed and observed in an organised fashion. As  , the velocity the ball reached can be calculated using the time recorded from the experiment, and the distance, which is the length of the incline which was simply measured with a ruler to be 0.91 metres. An example of this for the ball rolling down the 0.91m incline in one second is as follows:
Independent, dependent, and controlled variables
The independent variables in this experiment include the angle of the incline, the mass of the ball, and the mass distribution of the ball. The dependent variable in this experiment is the velocity of the ball. Controlled variables are variables apart from independent and dependent variables that can still affect the results of an experiment. The controlled variables in this experiment are the surface the ball is rolling on, the material the ball is made of, the size of the ball, the measuring devices being used, the distance the ball travels, and the method being used to release the ball each time, for example the position of the hand.
Safety
In this experiment safety glasses were worn by participants to prevent any possible damage to the eye. The “landing zone” where the ball reached the bottom of the ramp was blocked with a stack of textbooks. This choice was made as the ball possessed a reasonable amount of kinetic energy as it came off the incline, meaning it could interfere with other classmates’ experiments and even become a hazard. (for example knocking a glass beaker off a bench) While these situations are quite unlikely it is good practice to evaluate any possible errors that could occur in an experiment and prevent them from occurring in the first place through proper safety practices.
Test 1: How the angle of incline affects the velocity of a ball rolling down an incline.
|
Angle of incline (degrees) |
Time taken to roll down incline (seconds) |
||||
|
Test 1 |
Test 2 |
Test 3 |
Average |
||
|
5 |
1.82 |
1.59 |
1.68 |
1.70 |
|
|
10 |
1.12 |
1.15 |
1.04 |
1.10 |
|
|
15 |
0.82 |
0.63 |
0.81 |
0.75 |
|
|
20 |
0.75 |
0.69 |
0.63 |
0.69 |
|
|
25 |
0.66 |
0.44 |
0.59 |
0.56 |
|
|
30 |
0.66 |
0.69 |
0.47 |
0.61 |
|
|
35 |
0.59 |
0.53 |
0.63 |
0.58 |
|
|
40 |
0.41 |
0.53 |
0.47 |
0.47 |
|
|
45 |
0.50 |
0.54 |
0.47 |
0.50 |
|
By using the equation for velocity (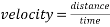 simplified as
  ), the above timed results can be converted into velocity. For example, finding the velocity of the ball from test one rolling down an incline of five degrees.
This process is then repeated for every single result and put into a table.
|
Angle of incline (degrees) |
Velocity reached (metres per second) |
||||
|
Test 1 |
Test 2 |
Test 3 |
Projected average |
Average |
|
|
5 |
0.50 |
0.57 |
0.54 |
1.06 |
0.54 |
|
10 |
0.81 |
0.79 |
0.88 |
1.50 |
0.83 |
|
15 |
1.11 |
1.44 |
1.12 |
1.83 |
1.21 |
|
20 |
1.21 |
1.32 |
1.44 |
2.08 |
1.32 |
|
25 |
1.38 |
2.07 |
1.54 |
2.31 |
1.63 |
|
30 |
1.38 |
1.32 |
1.94 |
2.51 |
1.49 |
|
35 |
1.54 |
1.72 |
1.44 |
2.70 |
1.57 |
|
40 |
2.22 |
1.72 |
1.94 |
2.85 |
1.94 |
|
45 |
1.82 |
1.69 |
1.94 |
2.99 |
1.82 |
Test 2: How mass affects the velocity of a ball rolling down an incline.
|
Mass of ball (grams) |
Time taken to roll down incline (seconds) |
|||||
|
Test 1 |
Test 2 |
Test 3 |
Test 4 |
Test 5 |
Average |
|
|
2.7 (Regular ball) |
0.71 |
0.85 |
0.78 |
0.78 |
0.71 |
0.77 |
|
36.2 (Ball filled with water) |
0.62 |
0.66 |
0.63 |
0.68 |
0.62 |
0.64 |
|
52.4 (Ball filled with sand) |
0.66 |
0.69 |
0.66 |
0.71 |
0.72 |
0.69 |
|
(Ball half filled with sand) |
0.94 |
0.87 |
0.88 |
1.10 |
0.94 |
0.95 |
These times were then converted into velocity using the same method as the previous results in test one.
|
Mass of ball (grams) |
Velocity reached (metres per second) |
|||||
|
Test 1 |
Test 2 |
Test 3 |
Test 4 |
Test 5 |
Average |
|
|
2.7 (Regular ball) |
1.28 |
1.07 |
1.17 |
1.17 |
1.28 |
1.18 |
|
36.2 (Ball filled with water) |
1.38 |
1.32 |
1.38 |
1.28 |
1.26 |
1.32 |
|
52.4 (Ball filled with sand) |
1.47 |
1.38 |
1.44 |
1.34 |
1.47 |
1.42 |
|
(Ball half filled with sand) |
0.97 |
1.05 |
1.03 |
0.83 |
0.97 |
0.96 |
Theoretical calculations

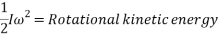
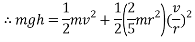
When a ball is rolling down an incline it’s gravitational potential energy is being converted into kinetic energy, however the potential energy is also being converted into rotational kinetic energy as the object is a ball.
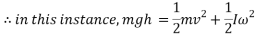
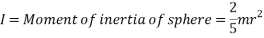


With all values substituted in, the equation for energy transformation is as follows:
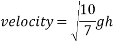
Which provides the velocity of the ball at the bottom of the incline:

(Hyperphysics.phy-astr.gsu.edu, 2017)
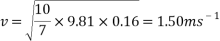
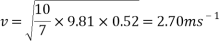
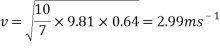
To find the velocity of the ball from this point, the values for g and h are simply substituted into the equation. For example, to find the theoretical velocity for a ball rolling down a ramp that is 10 centimetres high the equation will look like the following:
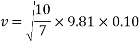

This equation will be used to work out the theoretical velocity for each ramp height.


All results can then be put input into a table or graph to observe and compare real results to theoretical results.
|
Angle of incline (degrees) |
Test 1 |
Test 2 |
Test 3 |
Average velocity (metres per second) |
Theoretical velocity (metres per second) |
|
5 |
0.50 |
0.57 |
0.54 |
0.54 |
1.06 |
|
10 |
0.81 |
0.79 |
0.88 |
0.83 |
1.50 |
|
15 |
1.11 |
1.44 |
1.12 |
1.21 |
1.83 |
|
20 |
1.21 |
1.32 |
1.44 |
1.32 |
2.08 |
|
25 |
1.38 |
2.07 |
1.54 |
1.63 |
2.31 |
|
30 |
1.38 |
1.32 |
1.94 |
1.49 |
2.51 |
|
35 |
1.54 |
1.72 |
1.44 |
1.57 |
2.70 |
|
40 |
2.22 |
1.72 |
1.94 |
1.94 |
2.85 |
|
45 |
1.82 |
1.69 |
1.94 |
1.82 |
2.99 |
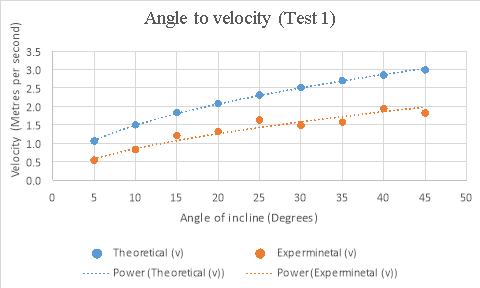
The results gathered from this experiment while not following theoretical results, prove to follow projected results relatively closely in the above graph. The comparison between the two sets of data shows that both quite closely follow the same path, however the real data is just lower than the theoretical data. Some possible reasons for this difference include the fact that the equation doesn’t account for friction, and the quantity of angular momentum. While the energy lost due to unaccounted for friction in the experiment would be negligible, as acceleration is an exponential value, a small change in the amount of energy in the experiment could noticeably change results quite quickly. The equation used for theoretical data also wasn’t accounting for the angular momentum of the ball. Angular momentum is a is a form of stored energy observed in things such as a rolling ball. This means while the ball in the experiment was rolling down the incline, it was storing part of its energy as angular momentum, taking away from the actual kinetic energy of the ball. Both factors combined can create quite a difference in real data compared to theoretical data, which is one explanation for the difference between real and theoretical data.
While the results are not perfect, in the angle to velocity graph the real data gets closer to the predicted theoretical value as the experiment goes on. The real results get proportionally closer to projected results even though looking at the real results there appear to be outlying data points bringing down the value for the average velocity of the ball in the second half of the graph. This is proven below. This proportional gap being closed more the further the experiment progresses is thought to be due to the exponential nature of acceleration.
First four points of graph:


Second four points of graph:


By evaluating the results from test 1, it is made clear that the higher the angle of incline, the higher velocity the ball will reach. In case the increase in velocity compared to increase in incline angle is not completely uniform. However the addition of a trend line shows that while there are outlying points lower than expected, the data shows that the velocity of the ball is still increasing as the angle of the incline increases, which supports the hypothesis of “The greater the angle of the incline the ball is rolling down, the greater velocity the ball will reach.”
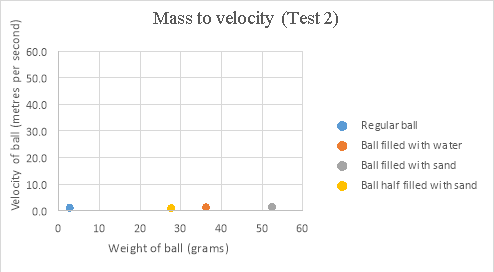
The second test involves four different ping pong balls. One is a regular ball, one filled with water, one filled with sand, and one half filled with sand. The ball half filled with sand will be ignored for now. By evaluating the results from test 2, it is shown that the regular ping pong ball (2.7g) is the slowest of the 3 balls being analysed, with an average velocity of 1.18 . The ball filled with water (36.2g) comes in with the next highest velocity with an average of 1.32. Lastly, the ball filled with fine sand (52.4g) reaches the highest average velocity of the three, coming in at 1.42. This data is seen displayed in the mass to velocity graph from test 2 on page 9. By analysing this graph it is made clear that the hypothesis of “The greater the mass of the ball, the greater velocity the ball will reach.” is supported, as the velocity is clearly seen going up as mass of the ball goes up.
The last hypothesis is related to the ping pong ball that was only half filled with sand that was mentioned previously. This ball was made with the intention of analysing the effects the center of mass has on a ball. This ball came in with an average velocity of 0.96, which is by far the lowest average velocity of the four balls. By observing the mass to velocity graph from test 2 it is clearly seen that the ball half filled with sand has a significantly lower velocity than the rest of the balls tested. Therefore, the hypothesis of “The more centered the mass of the ball, the greater velocity the ball will reach.” Is supported.
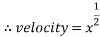
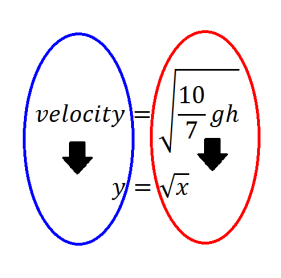
Using the square root function  the results from each set of data can be compared. The equation used to calculate theoretical data can be simplified to the square root function, meaning both equations can represent the same line. This will be demonstrated below.


Looking at the graphed results and placing a power trendline on each set of points shows that the above equation relates directly to the equation of the lines in the graph. This comparison is shown below.


Looking at the equations for each trendline it can be deduced that they can be represented by the square root function.
Throughout the experiment in this investigation there are many aspects that could lead to flawed or inaccurate data. While the data didn’t exactly match theoretical data, it quite closely followed the predictable nature of a power trendline. The results that stray the most from the trendline are the results from the second half of the angle of incline test, between 30 and 45 degrees. These seemingly anomalous results are most likely due to the measurements for the experiment being recorded by humans. The times for the experiment were recorded by a participant using a stopwatch, meaning there are multiple points throughout a single run of the experiment that could lead to inaccurate results. The first is the ball being released. One participant held the ball at the top of the incline, and with a countdown would release the ball, prompting the second participant to start the stopwatch. This part of the experiment alone can create slightly inaccurate data, as the participant starting the stopwatch is reacting to the visual que of the ball being released and the audio que of a countdown. According to backyardbrains.com, the average human reaction time to a visual stimulus is 0.25 seconds, and 0.17 seconds for audio stimulus. As both of these are involve
Cite This Work
To export a reference to this article please select a referencing stye below:
Related Services
View all


DMCA / Removal Request
If you are the original writer of this essay and no longer wish to have your work published on UKEssays.com then please click the following link to email our support team:
Request essay removal