Effect of Potential Difference on Copper Coating
| ✅ Paper Type: Free Essay | ✅ Subject: Physics |
| ✅ Wordcount: 1340 words | ✅ Published: 26 Jan 2018 |
|
Design
Research Question: –
What affect does the potential difference (V) across the circuit has on the copper coating on an iron metal?
Hypothesis: –
My hypothesis is based on the Ohm’s Law which states V = IR, where V is the potential difference across the circuit and ‘I’ is the current present in the circuit and ‘R’ is the resistance.
 (When ‘R’ is constant)
The above equation states that as the current increases, the electron flow will also increase. Thus increasing the potential difference across the circuit which in turn increases the copper coating on iron metal.
Variables: –
Independent Variable: – Potential difference
Dependent Variable: – Change in mass
Control Variable: –
- Concentration of the electrolyte
- Resistance of the circuit
- Temperature
- Distance between the electrodes
Materials Required: –
- Voltmeter (0.2 V)
- Ammeter (0.1 mA)
- Copper Plate
- Sand paper
- Iron nail
- Rheostat
- Connecting Wires
- Electrolyte (1M CuSO4 solution)
- Beaker
- Alligator Clips
- Weighing Scale (0.01 g)
Diagram of the experiment: –
Procedure: –
- Set up the experiment as shown in the diagram above.
- Take a sand paper and remove the rust from iron nail.
- Now place the iron nail on a weighing scale to get its weight.
- The iron nail should be now attached as the anode
- The potential difference should be kept as 1V
- Pour the electrolyte into a beaker and dip the iron nail into it for about 10mins.
- After 10mins, remove the iron nail and dry it.
- Repeat the above procedure for V = 1.5, 2, 2.5 and 3.
- Steps (1-8) should be repeated twice.
- Process the obtained data and record the observations.
How to control the Control Variables: –
- To control the concentration of electrolyte, make sure that the same electrolyte is used throughout the experiment.
- Resistance should be kept constant for the Hypothesis to be true, and for this a rheostat is used in the experiment by which resistance can be controlled.
- The experiment will be performed in a closed lab environment to ensure that the conditions of the equipment are not affected by changing atmospheric conditions.
- The distance between the electrodes should be kept constant because if the electrodes are not kept in a constant position, the rate of transfer of electrons will increase hence the mass deposited will also increase.
Data Control and Processing
Raw Data Table:-
The Raw Data Table consists of the data obtained from two trials and is shown below in a tabular form
Table 1
|
Trial 1 |
||
|
Potential Difference (V) |
Mass (g) |
|
|
Initial Mass (g) |
Final mass (g) |
|
|
1 |
1.560 |
1.596 |
|
1.5 |
1.596 |
1.641 |
|
2 |
1.641 |
1.706 |
|
2.5 |
1.706 |
1.791 |
|
3 |
1.791 |
1.881 |
Table 2
|
Trial 2 |
||
|
Potential Difference (V) |
Mass (g) |
|
|
Initial Mass (g) |
Final mass (g) |
|
|
1 |
1.580 |
1.616 |
|
1.5 |
1.616 |
1.664 |
|
2 |
1.664 |
1.711 |
|
2.5 |
1.711 |
1.797 |
|
3 |
1.797 |
1.889 |
Qualitative Observation: –
- Reddish-Brown coating on the iron nail when it is dipped in the electrolyte.
- When the current is passed, due to the flow of electrons from anode to cathode, the copper coating thickens as if it is trying to displace the iron.
- The iron nail becomes blunt due to the heavy deposition of copper.
After taking down the readings and noting the associated qualitative data, the raw data table is now processed and the data is represented graphically so that a better analysis could be done.
Processed Data Table: –
The processed Data table consists of two tables showing the change in mass after the data is obtained. A graphical representation of the data is also done.
Processed Table 1: –
|
Trial 1 |
|||
|
Potential difference (V±0.1) |
Mass (g±0.005) |
||
|
initial mass (g) |
final mass (g) |
change in mass (g) |
|
|
1.0 |
1.560 |
1.596 |
0.036 |
|
1.5 |
1.596 |
1.641 |
0.045 |
|
2.0 |
1.641 |
1.706 |
0.065 |
|
2.5 |
1.706 |
1.791 |
0.085 |
|
3.0 |
1.791 |
1.881 |
0.090 |
Change in Mass was calculated by subtracting the initial mass from the final mass,
For V = 1.0 ± 0.1,
Change in mass (ΔM) = Final Mass – Initial Mass
= 1.596g – 1.560g
= 0.036g
Similarly, Change in Mass was calculated for different Potential difference shown in the table.
Processed Table 2: –
|
Trial 2 |
|||
|
Potential difference (V±0.1) |
Mass (g±0.005) |
||
|
initial mass (g) |
final mass (g) |
change in mass (g) |
|
|
1.0 |
1.580 |
1.616 |
0.036 |
|
1.5 |
1.616 |
1.664 |
0.048 |
|
2.0 |
1.664 |
1.711 |
0.067 |
|
2.5 |
1.711 |
1.797 |
0.086 |
|
3.0 |
1.797 |
1.889 |
0.092 |
Similarly for this table,
For V = 3.0 ± 0.1
Change in mass (ΔM) = Final Mass – Initial Mass
= 1.889 – 1.797
= 0.092g
Graphical Representation: –
Trial 1
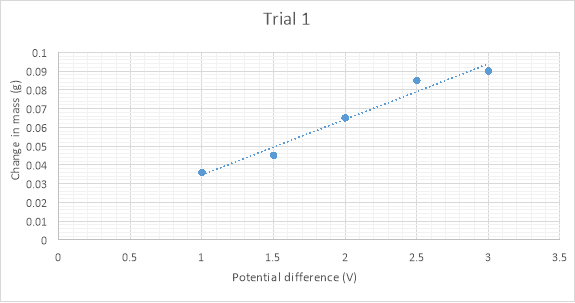
The above graph shows the relationship between Change in mass and Potential Difference. The obtained graph resembles a linear graph and the error bars are plotted. A trend line is also made to pass through all obtained values.
From the analysis of the graph of Trial 1, it can be observed that as the Potential difference increases the change in mass also increases which means that the amount of copper deposited increases with increasing potential difference.
Similarly, graph for trial 2 is shown below,
Graph 2
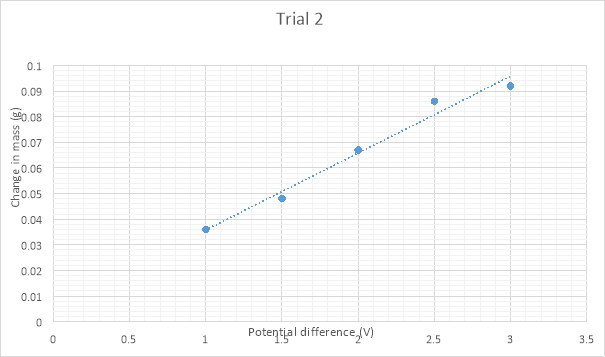
The graph obtained for Trial 2 also resembles a linear graph but there are some differences between the graph obtained for trial 1 and trial 2.
As Potential difference across the circuit increases, the Change in mass also increases which means that the copper coating thickens with increasing Potential difference.
Further Calculations are done to find the exact difference between both the trials,
Calculations: –
For trial 1,
The equation for the graph is y = 0.0296x + 0.005,
Finding the slope of the above graph,
m = 0.0296
Slope = 0.0296 gV-1
The slop obtained from differentiating the equation states that when 1V is increased, 0.0296 of Copper deposition takes place. This cycle continues for 1V increase.
Calculating the moles of Copper,
Moles = 
Moles = 
Moles = 
In Copper Sulphate, a +2 charge is present on Copper hence the required electrons will be as follows,

Calculating the transfer of charge,
Charge transferred = 
= 89.60 C
Increase in the current = 
= 0.149 A
For Trial 2,
The equation of this graph is y = 0.03x + 0.0058
By differentiating the above equation,
m = 0.03 gV-1
Calculating the moles of Copper,
No. of moles = Mass ÷ Molar Mass

Required amount of moles = 
= 9.44×10⁻⁴ mol at 1 p.d
Calculating the transfer of Charge,
Charge transfer = 
= 90.95 C
Increase in the Current = 90.95 C ÷ 600s
= 0.151 A
Conclusion and Evaluation
Conclusion
For Trial 1,
The Charge transfer obtained is 89.60 C
For Trial 2,
The Charge transfer is 90.95 C
The difference between both the charges = 90.95 – 89.60
= 1.35 C
Uncertainty of the experiment cannot be found out because the slope of both the graphs are different.
From the graph, it is seen that,

Evaluation
The major reason for this deviation from the trend line plotted in the graph indicates that the resistance was not controlled properly. The graph is plotted on the basis of the Ohm’s Law stating , when the Resistance ‘R’ is constant but in this experiment, both trial one and trial 2 have different value for Charge transfer thus it can be concluded that the experiment was not accurate because of the presence of fluctuating Resistance.
Errors that may have occurred
- The major reason for the experiment going wrong was due to an improper rheostat. The rheostat didn’t have a proper grip between the coil and movable scale. The scale may not be properly attached to the coil hence leading to a deviation between the obtained values.
- While removing rust from the iron nail using a sand paper, it may have had happened that some amount of rust remained on the surface of the iron nail and was not removed due to ignorance.
- The experiment was performed for approximately 4 hours. The experiment on the whole was not performed on a single day and hence some discrepancies in the solution may have had happened.
- The instruments used maybe were not calibrated properly.
- Number of trials taken in the experiment is only two which is very less as it does not give a big picture of the errors occurred while performing the experiment.
How to improve the experiment
- The experiment can be improved to a greater extent by using a rheostat which has a good grip between the coil and the moving scale. This can be done by checking the instruments before performing the experiment.
- A fresh iron nail should be taken for the experiment. If it is not taken, then due to carelessness, some rust may remain on the iron nail and at one point it will become so thick that removing it with a sand paper won’t be possible.
- The experiment should be conducted for a shorter period of time and should be performed on one day itself because if the solution is kept open, it may happen that the solution will degrade or will react with air.
- Instruments with proper least count should be taken to avoid any systematic error.
- A minimum of five trials should be taken to reach an accurate conclusion.
Cite This Work
To export a reference to this article please select a referencing stye below:
Related Services
View all


DMCA / Removal Request
If you are the original writer of this essay and no longer wish to have your work published on UKEssays.com then please click the following link to email our support team:
Request essay removal