Case Study- Bayfield Mud Company
| ✅ Paper Type: Free Essay | ✅ Subject: Management |
| ✅ Wordcount: 505 words | ✅ Published: 19 Sep 2017 |
- Dilip
- Navjot
- Amanpreet Singh
Introduction
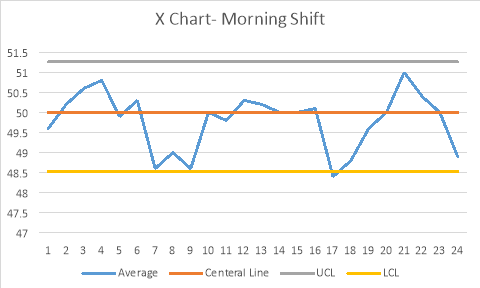
According to the case study of the bag weight problem, therefore the control department gathered the weight bag as a sample from three different shifts (morning, afternoon, night) every day. As per given report the six samples collected per shift, therefore the size of the sample is six. To analysis the report of three different shift, we will apply x-bar chart and range chart.

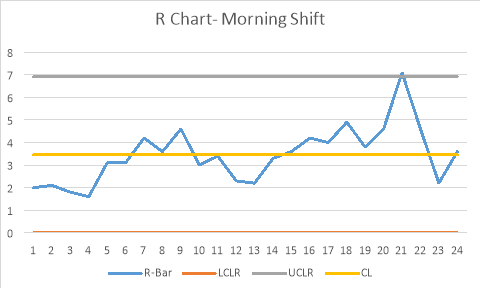
Moreover we will take mean value i.e is 50, explanation given below. In addition we will also calculate the range chart figure for every samples in different shifts, which will be find out by applying formula (Largest-Smallest).
Analysis
D3(Value taken from Sigma table)=0
D4 (Value taken from Sigma table)==2.004
N(Sample Size)=6
Standard Deviation=1.2
Desired Control Limit 3Sigma =99.73%
Formulation
For X Chart
UCL x (Upper Control Limit for x bar) = X-Dbl Bar+Zï€ ï³x
Lower Control Limit (Upper Control Limit = X-Dbl Bar-Zï€ ï³x
ï³x= is calculated by ï³/Sqrt(n)
For R Chart
UCLR (Upper Control Limit for the Range) = D4*RBar
LCLR(Lower Control Limit for the Range)= D3*Rbar
|
Morning Shift |
For X Chart |
For R Chart |
||||||||
|
Samples |
Time |
Shifts |
Average |
Smallest |
Largest |
Range |
X Bar (Averages) |
49.80 |
R-Bar (CL) |
3.45 |
|
1 |
6 |
Day 1 Morning |
49.6 |
48.7 |
50.7 |
2.0 |
UCLx |
51.27 |
LCL r |
0.00 |
|
2 |
7 |
50.2 |
49.1 |
51.2 |
2.1 |
LCLx |
48.33 |
UCL r |
6.91 |
|
|
3 |
8 |
50.6 |
49.6 |
51.4 |
1.8 |
CL |
50 |
|||
|
4 |
9 |
50.8 |
50.2 |
51.8 |
1.6 |
|||||
|
5 |
10 |
49.9 |
49.2 |
52.3 |
3.1 |
|||||
|
6 |
11 |
50.3 |
48.6 |
51.7 |
3.1 |
|||||
|
7 |
12 |
48.6 |
46.2 |
50.4 |
4.2 |
|||||
|
8 |
1 |
49 |
46.4 |
50 |
3.6 |
|||||
|
9 |
6 |
Day 2 Morning |
48.6 |
47.4 |
52 |
4.6 |
||||
|
10 |
7 |
50 |
49.2 |
52.2 |
3.0 |
|||||
|
11 |
8 |
49.8 |
49 |
52.4 |
3.4 |
|||||
|
12 |
9 |
50.3 |
49.4 |
51.7 |
2.3 |
|||||
|
13 |
10 |
50.2 |
49.6 |
51.8 |
2.2 |
|||||
|
14 |
11 |
50 |
49 |
52.3 |
3.3 |
|||||
|
15 |
12 |
50 |
48.8 |
52.4 |
3.6 |
|||||
|
16 |
1 |
50.1 |
49.4 |
53.6 |
4.2 |
|||||
|
17 |
6 |
Day 3 Morning |
48.4 |
45 |
49 |
4.0 |
||||
|
18 |
7 |
48.8 |
44.8 |
49.7 |
4.9 |
|||||
|
19 |
8 |
49.6 |
48 |
51.8 |
3.8 |
|||||
|
20 |
9 |
50 |
48.1 |
52.7 |
4.6 |
|||||
|
21 |
10 |
51 |
48.1 |
55.2 |
7.1 |
|||||
|
22 |
11 |
50.4 |
49.5 |
54.1 |
4.6 |
|||||
|
23 |
12 |
50 |
48.7 |
50.9 |
2.2 |
|||||
|
24 |
1 |
48.9 |
47.6 |
51.2 |
3.6 |
|||||
|
Afternoon Shift |
For X Chart |
For R Chart |
||||||||
|
Samples |
Time |
Shifts |
Average |
Smallest |
Largest |
Range |
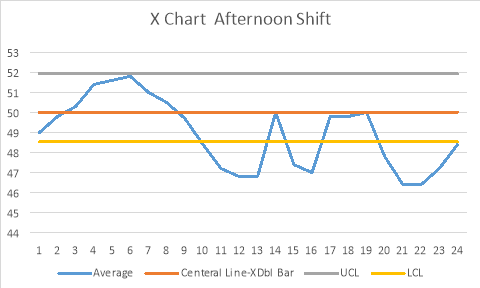
X Bar (Averages) |
48.93 |
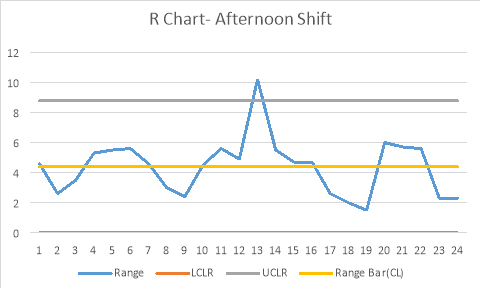
R-Bar (CL) |
4.38 |
|
1 |
2 |
Day 1 Afternoon |
49 |
46 |
50.6 |
4.6 |
UCLx |
50.40 |
LCL r |
0.00 |
|
2 |
3 |
49.8 |
48.2 |
50.8 |
2.6 |
LCLx |
47.46 |
UCL r |
8.78 |
|
|
3 |
4 |
50.3 |
49.2 |
52.7 |
3.5 |
CL |
50 |
|||
|
4 |
5 |
51.4 |
50 |
55.3 |
5.3 |
|||||
|
5 |
6 |
51.6 |
49.2 |
54.7 |
5.5 |
|||||
|
6 |
7 |
51.8 |
50 |
55.6 |
5.6 |
|||||
|
7 |
8 |
51 |
48.6 |
53.2 |
4.6 |
|||||
|
8 |
9 |
50.5 |
49.4 |
52.4 |
3 |
|||||
|
9 |
2 |
Day 2 Afternoon |
49.70 |
48.6 |
51 |
2.4 |
||||
|
10 |
3 |
48.4 |
47.2 |
51.7 |
4.5 |
|||||
|
11 |
4 |
47.20 |
45.3 |
50.9 |
5.6 |
|||||
|
12 |
5 |
46.8 |
44.1 |
49 |
4.9 |
|||||
|
13 |
6 |
46.8 |
41 |
51.2 |
10.2 |
|||||
|
14 |
7 |
50 |
46.2 |
51.7 |
5.5 |
|||||
|
15 |
8 |
47.4 |
44 |
48.7 |
4.7 |
|||||
|
16 |
9 |
47 |
44.2 |
48.9 |
4.7 |
|||||
|
17 |
2 |
Day 3 Afternoon |
49.8 |
48.4 |
51 |
2.6 |
||||
|
18 |
3 |
49.8 |
48.8 |
50.8 |
2 |
|||||
|
19 |
4 |
50 |
49.1 |
50.6 |
1.5 |
|||||
|
20 |
5 |
47.8 |
45.2 |
51.2 |
6 |
|||||
|
21 |
6 |
46.4 |
44 |
49.7 |
5.7 |
|||||
|
22 |
7 |
46.4 |
44.4 |
50 |
5.6 |
|||||
|
23 |
8 |
47.2 |
46.6 |
48.9 |
2.3 |
|||||
|
24 |
9 |
48.4 |
47.2 |
49.5 |
2.3 |
|||||
|
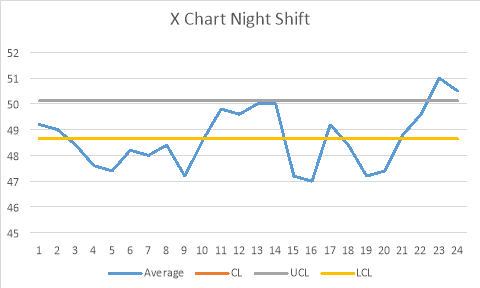
Night Shifts |
X Bar Chart |
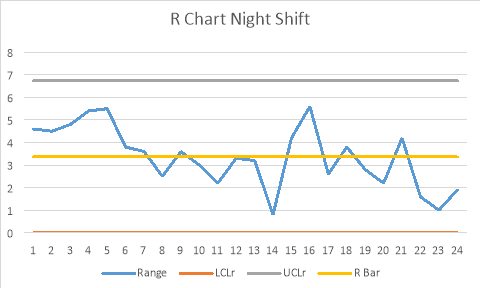
R Chart |
||||||||
|
Samples |
Time |
Shifts |
Average |
Smallest |
Largest |
R-Bar |
X Bar Average |
48.65 |
R- Bar (CL) |
3.36 |
|
1 |
10 |
Day1 Night |
49.2 |
46.1 |
50.7 |
4.6 |
UCLx |
51.50 |
UCLr |
6.73 |
|
2 |
11 |
49 |
46.3 |
50.8 |
4.5 |
LCLx |
45.80 |
LCLr |
0 |
|
|
3 |
12 |
48.40 |
45.4 |
50.2 |
4.8 |
CL |
50 |
|||
|
4 |
1 |
47.6 |
44.3 |
49.7 |
5.4 |
|||||
|
5 |
2 |
47.4 |
44.1 |
49.6 |
5.5 |
|||||
|
6 |
3 |
48.20 |
45.2 |
49 |
3.8 |
|||||
|
7 |
4 |
48 |
45.5 |
49.1 |
3.6 |
|||||
|
8 |
5 |
48.40 |
47.1 |
49.6 |
2.5 |
|||||
|
9 |
10 |
Day 2 Night |
47.2 |
46.6 |
50.2 |
3.6 |
||||
|
10 |
11 |
48.6 |
47 |
50 |
3 |
|||||
|
11 |
12 |
49.8 |
48.2 |
50.4 |
2.2 |
|||||
|
12 |
1 |
49.6 |
48.4 |
51.7 |
3.3 |
|||||
|
13 |
2 |
50 |
49 |
52.2 |
3.2 |
|||||
|
14 |
3 |
50 |
49.2 |
50 |
0.8 |
|||||
|
15 |
4 |
47.2 |
46.3 |
50.5 |
4.2 |
|||||
|
16 |
5 |
47 |
44.1 |
49.7 |
5.6 |
|||||
|
17 |
10 |
Day 3 Night |
49.2 |
48.1 |
50.7 |
2.6 |
||||
|
18 |
11 |
48.40 |
47 |
50.8 |
3.8 |
|||||
|
19 |
12 |
47.2 |
46.4 |
49.2 |
2.8 |
|||||
|
20 |
1 |
47.4 |
46.8 |
49 |
2.2 |
|||||
|
21 |
2 |
48.8 |
47.2 |
51.4 |
4.2 |
|||||
|
22 |
3 |
49.6 |
49 |
50.6 |
1.6 |
|||||
|
23 |
4 |
51 |
50.5 |
51.5 |
1 |
|||||
|
24 |
5 |
50.5 |
50 |
51.9 |
1.9 |
|||||
Analysis Report
After calculating and analysing the three different shifts of three days. We can observe that second shift and third shift consistently out of control. Although, 21 Samples of range chart is only out of control which is 7.10 which is greater than UCLr which is 6.9. Despite, this is only shift which is in control.
By observing the second shift it is clearly seen that x chart is out of control, whereas R chart of second shift is in control only 13 Samples is out of control which is 10.20 whereas UCLr is 8.7842
Now, for third shift, the X bar Chart the process is consistently out of control whereas the R chart is perfectly in control.
Recommendation.
In order to control the system, Company should be done some changes, mention below
- In order to build up the productivity, training should be provide to the new employees especially in the night shift. Another solution company can shift experienced employee in night shift to maintain the balance.
- Bayfield Mud Company should examine their machinery on regular basis as prescribed by managers. As we know a small issued can convert into big hindrance at the time of execution.
- Company should hire some quality control specialist who can take proper responsibilities of audit and track every problems with all documents in efficient way.
- Bayfield Company should do automated testing device to observe the bag weights.
Cite This Work
To export a reference to this article please select a referencing stye below:
Related Services
View all


DMCA / Removal Request
If you are the original writer of this essay and no longer wish to have your work published on UKEssays.com then please click the following link to email our support team:
Request essay removal