Tensile Properties of Polypropylene
| ✅ Paper Type: Free Essay | ✅ Subject: Engineering |
| ✅ Wordcount: 1546 words | ✅ Published: 30 Aug 2017 |
Introduction
If an engineer wanted to design a bridge to span a river, it would be absurd to consider building it out of papier-mâché or rubber. We know this because we know something about the demands that will be put on the bridge and we know that these materials do not satisfy the requirements. After considering other materials, perhaps titanium or high tech aluminium alloys, we may discount them on the grounds of cost – even if they do have suitable mechanical properties to make a good bridge. Eventually we may decide on steel; but which one? There are thousands to choose from. Which has the best properties at an affordable price? The cost effectiveness of any material is a matter not to be dealt with here but we must ask “which steel has the most appropriate physical properties”. In order to answer this question, we must conduct tests on different steels and compare the results when samples of the steel are tested to destruction.
Polypropylene has the ability to crystallise which was a very exciting prospect as it is also an economical material so the popularity of it grew and production began all across most of Europe its use. Lots of different types of polypropylene have been under production since the early 1950s mainly because of its insulating properties. it is used in many different fields, bumpers and some of the interior in a car is developed using polypropylene it’s also widely used in electrical components because of its great electrical resistance at high temperatures. It has similar properties to polyethylene.
Because of its use in many different fields its necessary to test the material in a variety of ways. In this test the tensile properties will be examined at different testing speeds. This test is done because
The test process involves placing the test specimen in the testing machine and slowly extending it until it fractures. During this process, the elongation of the gauge section is recorded against the applied force. The data is manipulated so that it is not specific to the geometry of the test sample.
Theory
Polypropylene, like other plastics, typically starts with the distillation of hydrocarbon fuels into lighter groups called “fractions” some of which are combined with other catalysts to produce plastics (typically via polymerisation or poly-condensation)
For example, the polymerisation of propylene, which is identical to ethylene except that one hydrogen substituent has been replaced by a methyl (CH3) group, yields “polypropylene”. This material has a higher melting point (160-170 oC), higher tensile strength, and greater rigidity than polyethylene.
Figure 1-
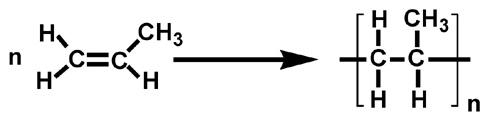
Propylene monomers polymerisation to polypropylene
Depending on how they are linked or joined (chemical bonds or intermolecular forces) and on the arrangement of the different chains that forms the polymer, the resulting polymeric materials can be classified as:
- Thermoplastics
- Elastomers
- Thermosets
Depending on the chemical composition, polymers can be inorganic such as glass, or they can be organic, such as adhesives of epoxy resin. Organic polymers can be also divided into natural polymers such as proteins and synthetic polymers as thermosets materials.
Description of apparatus
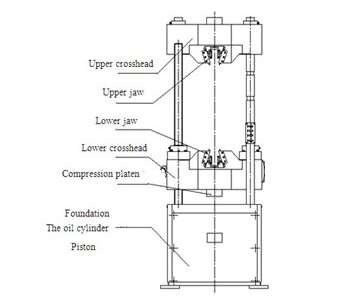
The apparatus used the most for the testing part of the experiment was the zwick tensile testing machine this is a highly accurate piece of equipment as it has high resolution angle measurement which allows excellent repeat accuracy.
This type of machine has two crossheads; one is adjusted for the length of the specimen and the other is driven to apply tension to the test specimen
he machine must be able to generate enough force to fracture the specimen. The machine must be able to apply the force quickly or slowly enough to properly mimic the actual application. Finally, the machine must be able to accurately and precisely measure the gauge length and forces applied
Figure 2-
Tensile testing machine (diagrammatic sketch form)
Test procedure
The test will be carried out using the Zwick tensile testing machine, with 3 different specimens each of them will be extended at different speeds
Specimen 1: Extension speed= 100 mm/min
Specimen 2: Extension speed= 50 mm/min
Specimen 3: Extension speed= 12.5 mm/min
Before testing the specimens, they must be measured before and after the test to see what impact the test had on the specimens
After the measurement, have been taken its required to make a table to compare the load to the extension this graph will be required to estimate relevant values that will be needed to complete the calculations.
For all the specimens you are required to obtain a verity of tensile properties including:
- Nominal yield stress
- Young’s modulus
- Fracture stress (nominal and true)
- Tensile ductility
Results
|
Specimen |
(mm) |
Average (mm) |
Av.CSA = tw ( |
|||
|
1 |
T |
2.13 |
2.18 |
2.20 |
2.17 |
10.20 |
|
W |
4.68 |
4.73 |
4.70 |
4.70 |
||
|
2 |
T |
2.13 |
2.15 |
2.16 |
2.14 |
10.10 |
|
W |
4.68 |
4.72 |
4.71 |
4.70 |
||
|
3 |
T |
2.14 |
2.15 |
2.16 |
2.15 |
10.11 |
|
W |
4.70 |
4.72 |
4.69 |
4.70 |

Specimen 1 calculated results when extended at speed of 100 mm/min –
|
Gauge Length (mm) |
33.00 |
|
Initial cross-sectional area ( |
10.21 |
|
Fracture length (mm) |
(55-33) 22.00 |
|
Thickness at fracture (mm) |
0.91 |
|
Width at fracture (mm) |
2.50 |
|
Cross-sectional area at Fracture ( |
2.28 |
|
Load at yield (N) |
270.00 |
|
Load at fracture (N) |
170.00 |
|
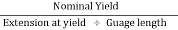
Nominal yield stress ( |
26.45 |
|
Extension at high yield (mm) |
1.54 |
|
Young modulus ( |
566.79 |
|
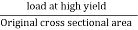
Nominal fracture stress ( |
16.65 |
|
True fracture stress ( |
74.56 |
|
Tensile Ductility (mm) |
0.66 |
 )
) )
)Specimen 2 calculated results when extended at speed of 50 mm/min –
|
Gauge Length (mm) |
33.00 |
|
Initial cross-sectional area ( |
10.10 |
|
Fracture length (mm) |
(123-33) 90.00 |
|
Thickness at fracture (mm) |
0.93 |
|
Width at fracture (mm) |
2.61 |
|
Cross-sectional area at Fracture ( |
2.43 |
|
Load at yield (N) |
262.50 |
|
Load at fracture (N) |
172.50 |
|
Nominal yield stress ( |
25.99 |
|
Extension at high yield (mm) |
1.54 |
|
Young modulus ( |
556.93 |
|
Nominal fracture stress ( |
17.08 |
|
True fracture stress ( |
70.98 |
|
Tensile Ductility |
2.72 |
 )
) )
)Specimen 3 calculated results when extended at speed of 12.5 mm/min –
|
Gauge Length (mm) |
33.00 |
|
Initial cross-sectional area ( |
10.11 |
|
Fracture length (mm) |
(242-33) 209.00 |
|
Thickness at fracture (mm) |
0.88 |
|
Width at fracture (mm) |
2.01 |
|
Cross-sectional area at Fracture ( |
1.77 |
|
Load at yield (N) |
273.75 |
|
Load at fracture (N) |
267.50 |
|
Nominal yield stress ( |
27.08 |
|
Extension at high yield (mm) |
110.26 |
|
Young modulus ( |
8.08 |
|
Nominal fracture stress ( |
26.46 |
|
True fracture stress ( |
151.13 |
|
Tensile Ductility |
6.33 |
Calculations of average cross sectional area specimen 1
Average cross sectional area = Average thickness x Average width
Average cross sectional area = 2.17 mm x 4.70 mm = 10.20 
Calculations of specimen 1
- Nominal yield =
Nominal yield =  = 26.45
- Young’s modulus=
Young’s modulus= 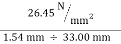 = 566.79
- Nominal fracture stress =

Nominal fracture stress =  = 16.65
- True fracture stress =

True fracture stress =  = 74.56
- Tensile ductility =

Tensile ductility =  = 0.66 mm
Graphs
Figure 3-
Graph of load vs extension for specimen 1-
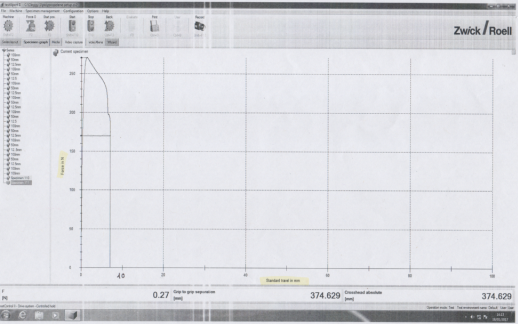
Figure 4-
Graph of load vs extension for specimen2-
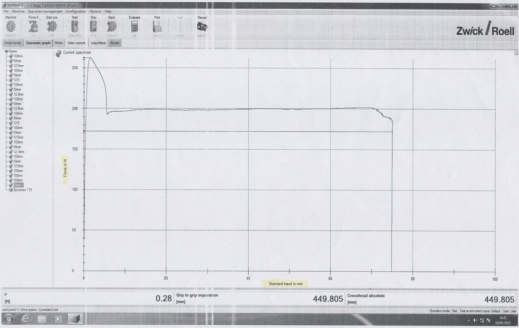
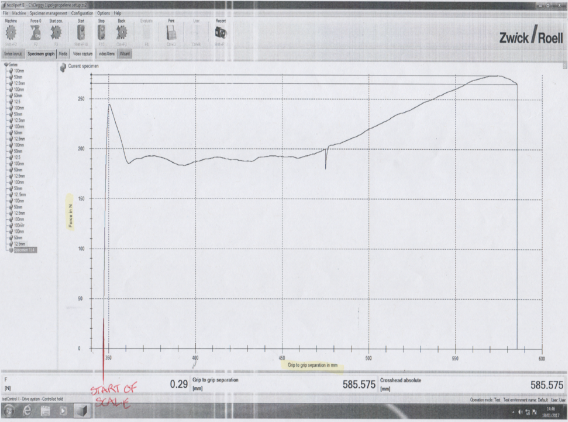
Figure 5-
Graph of load vs extension for specimen 3-
Discussion
Unsurprisingly when you inspect between the three graphs you can see a slight pattern occur which is that the faster you extend the Polypropylene the quicker it breaks. The graph readings are used to find how much it was extended when broken so that the tensile ductility can be worked out. There have been errors in the graphs because in the laboratory the measured extension of the break was 22mm whereas the zwick tensile testing machine made a graph that showed it to be a lot less around 8mm which is surprising to have such a varied result. Retrieving most of the results from the graph required a lot of estimation because specimens one and two had scales of 20 and specimen 3 had a scale of 50 these both aren’t precise enough to get an accurate reading of the graph so a lot of estimation was required.
As it can be seen in the results the extension at high yield point was very different for specimen 3 compared to the other specimens, this at first glance could be considered as an anomaly even though this was expected because the less stress that is put on the specimen meant that the extension of the yield would be higher but such a big gap wasn’t expected. However, looking at the results of the other groups in the lab it shows that the result is acceptable. The other result that differed in specimen 3 when compared to the other specimens was the load at fracture this is because specimen 3 extended for a much longer distance then the other two so there was much more load at fracture which meant that the fracture stress was much greater too as shown in the results.
Also, glass transition temperature had to be controlled so that the polypropylene wasn’t too brittle, as temperature is hard to get accurate most of the readings might have differed because of it.
Conclusion
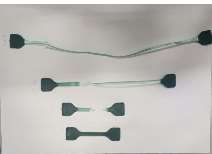
It can be seen in this test how speed effects the tensile properties of polypropylene, as the results and graphs show that when tension is applied quicker as its done in the first specimen it can take a lot less stress to break the polypropylene compared to the 3rd specimen which took a lot more tension because it expanded much more than the other 2 specimens as seen in figure 6.
The results of the test are reliable but improvements could have been made the graph could have a much smaller scale which would have made the readings off the graph much easier to obtain. Also, there were assumptions that were made while doing this for example when working out the young’s modulus we had to assume that the line between the origin and the high yield point is linear.
Figure- 6
Photos of the 3 specimens before and after the test.
References
Information
https://www.creativemechanisms.com/blog/all-about-polypropylene-pp-plastic
http://www.bpf.co.uk/plastipedia/polymers/pp.aspx
https://en.wikipedia.org/wiki/Tensile_testing
Images
http://www.chemistry.wustl.edu/~edudev/Designer/session4.html
Cite This Work
To export a reference to this article please select a referencing stye below:
Related Services
View all


DMCA / Removal Request
If you are the original writer of this essay and no longer wish to have your work published on UKEssays.com then please click the following link to email our support team:
Request essay removal