Buckling Experiments Laboratory Report
| ✅ Paper Type: Free Essay | ✅ Subject: Engineering |
| ✅ Wordcount: 1533 words | ✅ Published: 31 Aug 2017 |
BUCKLING EXPERIMENT
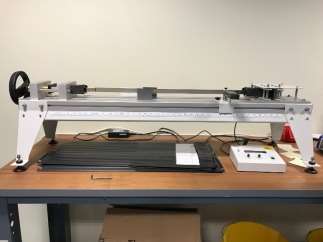
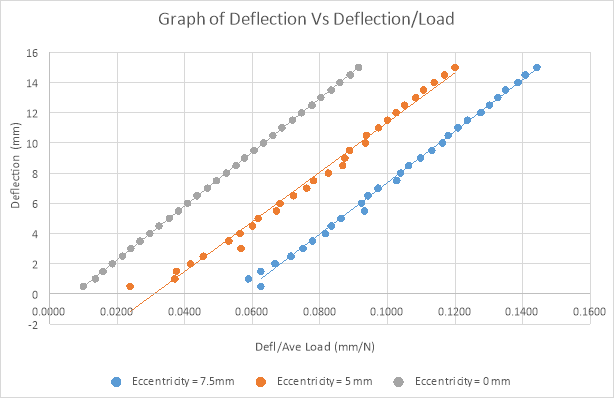
The experiment entails subjecting loads to a strut along its centroidal axis. The effects of length, shape, material and fixing conditions on buckling were observed. An analysis was then done basing on the results obtained and graphs drawn to establish various relationships measured and calculated. The buckling load was also determined theoretically for all the struts basing on the geometry and material properties. This was then compared to those found experimentally.
Buckling is an instability of a material when subjected to loading which eventually leads to failure. It is characterized by sudden sideways deflection of the structural member. When load is applied on a material, it will become large causing it to become unstable and consequently causing change in shape and this can be said to have buckled. This can happen even when the stress subjected on the material is below that needed to cause failure.
Bending and buckling can cause change in shape but the difference comes in the method of applying the load. For the bending case, the load is applied perpendicular to the centroidal axis while in buckling, the load is applied axially causing compressive stress and eventual sideways failure.

This feature can be measured as the buckling load. Materials having different properties have different buckling loads which is a function of the length of the column and the second moment of area of its cross section.
Buckling loads can be determined experimentally or by way of a prediction without actually loading the material to critical load. Southwell plot is a chart of used to experimentally determine the critical load of a structure without subjecting it to its critical load. It is a non-destructive testing method for buckling.
Southwell plot is a graphical representation of deflection(y) against deflection by load applied(y/L). This should in return show a linear relationship and a slight curvature at low values of deflection. Further analysis can be done to obtain buckling load. Critical loads can thus be obtained without actually buckling the load itself reducing risk of damaging the strut. The intercept represents the total eccentricity of the strut which is the eccentricity within the equipment and the strut together with the imposed eccentricity.
- To compare the theoretical and experimental buckling loads of struts in order to test the theory and show its limits.
- To show how to use the Southwell plot to find the buckling load and eccentricity of a strut.
The potential hazards was assessed and it was observed to be majorly from the experiment handling of the strut in loading and unloading. This has a potential harm to the colleagues and the staff in the laboratory.
This hazard was considered by performing the experiment heavily. Plastic inserts were also used to reduce the adverse possible reaction of the strut on loading. The load was applied slowly with full concentration on the reaction of the material under loading so as not to exceed the buckling limits. The strut was also released by unloading swiftly.

Experiment 1
- The Load Display was connected and switched on. It was then given some few minutes for the display and the load cell to warm up. The load measuring end was tapped to remove any effects of friction and the display zeroed.
- The digital calipers was then used to obtain the dimensions of the 750 mm steel strut and its second moment of area calculated.
- The strut was then fit into the rig with the pinned ends condition.
- Plastic inserts were then inserted in the channels adjacent to the center of the strut such that when load was applied the strut would not come into contact with the inserts.
- The large hand wheel was used to load the strut slowly. As the wheel was turning, the load reading and the deflection of the strut was observed heavily. The plastic insert was used to ensure that the strut does not buckle further than 15mm.The peak load on the display was recorded and the hand wheel turned to release the load. This is the reading for buckling on its natural direction.
- A light load was then applied and gently pushed on the center to force it to buckle in the opposite direction. The load was then increased until the strut buckled end the peak load recorded. The load was then released.
- The mean of the two buckling loads was thereafter calculated.
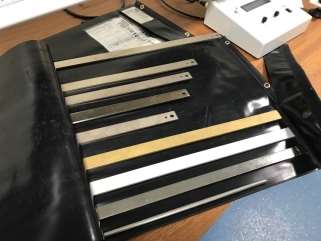
- The procedure was repeated for the other steel struts No 2 to No 6. And for one strut made from a different material and the other shape. For strut No 4, the experiment was repeated with a fixed to pinned end condition and strut No 3 with fixed to fixed end conditions.
- The curve of length against average experimental buckling load was plotted for steel struts 1 – 6. Theoretical buckling load was then calculated for each length and then plotted on the graph.
- Comments on the effect of length, end conditions, material and 2nd moment of area on the buckling loads were then made.
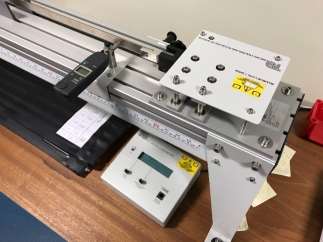
Experiment 2
- The Load Display was connected and switched on. It was then given some few minutes for the display and the load cell to warm up. The load measuring end was tapped to remove any effects of friction and the display zeroed.
- The 750 mm steel strut was obtained.
- The strut was then fixed on the pinned ends condition.
- The deflection gauge was then fitted at the midspan of the strut while ensuring that there is 15mm of travel in the natural buckling direction.
- The strut was then tested in the natural buckling direction while recording the load at deflection intervals of 0.5mm.
- The table of results was then filled.
- The Eccentric End fittings were then fitted to strut number 2 with both fittings set to give the smallest eccentricity (5mm)
- Strut number 2 was fitted and the position of the deflection indicator adjusted to allow for the offset.
- The test was then repeated with the same strut.
- The end fittings at both ends of the strut were reversed to give larger eccentricity. The indicator was adjusted and the test repeated.
- A chart was then created showing load on the vertical axis against deflection on the horizontal axis. The results from each strut was added to the chart.
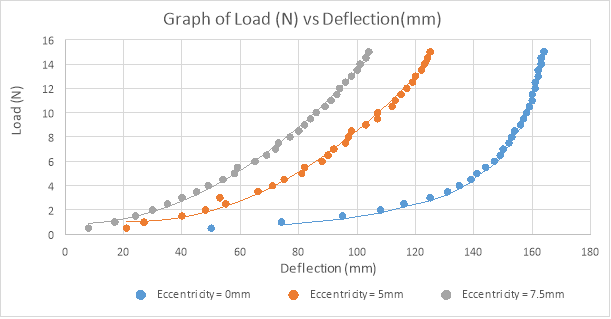
- A chart for a Southwell plot was created, deflection (y) against (y/P) where P is the load. The results from each strut was then added to this chart and further analysis done
|
Theoretical buckling load (N) |
174.70 |
240.40 |
306.10 |
280.52 |
397.56 |
339.33 |
332.99 |
826.75 |
304.39 |
359.29 |
|
|
Average Peak buckling load(N) |
189.5 |
198 |
236 |
257 |
286.5 |
327 |
283 |
279 |
559 |
1068 |
|
|
Peak buckling load 2(N) |
212 |
204 |
251 |
251 |
288 |
334 |
294 |
292 |
579 |
1187 |
|
|
Peak buckling load 1(N) |
167 |
192 |
221 |
263 |
285 |
320 |
272 |
266 |
539 |
949 |
|
|
Strut Details |
2nd Moment of area |
48.103 |
57.649 |
63.311 |
53.636 |
70.055 |
50.244 |
180.746 |
170.974 |
53.636 |
63.311 |
|
d |
3.11 |
3.20 |
3.41 |
3.23 |
3.54 |
3.15 |
4.84 |
6.46 |
3.23 |
3.41 |
|
|
b |
19.19 |
19.25 |
19.16 |
19.10 |
19.44 |
19.39 |
19.13 |
_ |
19.10 |
19.16 |
|
|
K value |
1 |
1 |
1 |
1 |
1 |
1 |
1 |
1 |
0.7 |
0.5 |
|
|
Fixing conditions |
P-P |
P-P |
P-P |
P-P |
P-P |
P-P |
P-P |
P-P |
P-F |
F-F |
|
|
Youngs modulus (N/mm2) |
207000 |
207000 |
207000 |
207000 |
207000 |
207000 |
105000 |
207000 |
207000 |
207000 |
|
|
Material |
Steel |
Steel |
Steel |
Steel |
Steel |
Steel |
Brass |
Steel |
Steel |
Steel |
|
|
Shape |
Rect |
Rect |
Rect |
Rect |
Rect |
Rect |
Rect |
Round |
Rect |
Rect |
|
|
Working length |
750 |
700 |
650 |
625 |
600 |
550 |
750 |
650 |
600 |
600 |
|
|
Strut no |
1 |
2 |
3 |
4 |
5 |
6 |
7 |
J |
4 |
3 |
|
|
Deflection (mm) |
Eccentricity=0 |
Eccentricity=5mm |
Eccentricity=7.5mm |
|||
|
Load (N) |
Defl/Ave Load |
Load (N) |
Defl/Ave Load |
Load (N) |
Defl/Ave Load |
|
|
0 |
0 |
_ |
0 |
_ |
0 |
_ |
|
0.5 |
50 |
0.0100 |
21 |
0.0238 |
8 |
0.0625 |
|
1 |
74 |
0.0135 |
27 |
0.0370 |
17 |
0.0588 |
|
1.5 |
95 |
0.0158 |
40 |
0.0375 |
24 |
0.0625 |
|
2 |
108 |
0.0185 |
48 |
0.0417 |
30 |
0.0667 |
|
2.5 |
116 |
0.0216 |
55 |
0.0455 |
35 |
0.0714 |
|
3 |
125 |
0.0240 |
53 |
0.0566 |
40 |
0.0750 |
|
3.5 |
131 |
0.0267 |
66 |
0.0530 |
45 |
0.0778 |
|
4 |
135 |
0.0296 |
71 |
0.0563 |
49 |
0.0816 |
|
4.5 |
139 |
0.0324 |
75 |
0.0600 |
54 |
0.0833 |
|
5 |
141 |
0.0355 |
81 |
0.0617 |
58 |
0.0862 |
|
5.5 |
144 |
0.0382 |
82 |
0.0671 |
59 |
0.0932 |
|
6 |
147 |
0.0408 |
88 |
0.0682 |
65 |
0.0923 |
|
6.5 |
149 |
0.0436 |
90 |
0.0722 |
69 |
0.0942 |
|
7 |
150 |
0.0467 |
92 |
0.0761 |
72 |
0.0972 |
|
7.5 |
152 |
0.0493 |
96 |
0.0781 |
73 |
0.1027 |
|
8 |
153 |
0.0523 |
97 |
0.0825 |
77 |
0.1039 |
|
8.5 |
154 |
0.0552 |
98 |
0.0867 |
80 |
0.1063 |
|
9 |
156 |
0.0577 |
103 |
0.0874 |
82 |
0.1098 |
|
9.5 |
157 |
0.0605 |
107 |
0.0888 |
84 |
0.1131 |
|
10 |
158 |
0.0633 |
107 |
0.0935 |
86 |
0.1163 |
|
10.5 |
159 |
0.0660 |
112 |
0.0938 |
89 |
0.1180 |
|
11 |
160 |
0.0688 |
113 |
0.0973 |
91 |
0.1209 |
|
11.5 |
160 |
0.0719 |
115 |
0.1000 |
93 |
0.1237 |
|
12 |
161 |
0.0745 |
117 |
0.1026 |
94 |
0.1277 |
|
12.5 |
161 |
0.0776 |
119 |
0.1050 |
96 |
0.1302 |
|
13 |
162 |
0.0802 |
120 |
0.1083 |
98 |
0.1327 |
|
13.5 |
162 |
0.0833 |
122 |
0.1107 |
100 |
0.1350 |
|
14 |
163 |
0.0859 |
123 |
0.1138 |
101 |
0.1386 |
|
14.5 |
163 |
0.0890 |
124 |
0.1169 |
103 |
0.1408 |
|
15 |
164 |
0.0915 |
125 |
0.1200 |
104 |
0.1442 |
Moment of inertia (I) of a circle and rectangle were obtained using the formula;
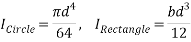
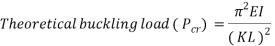
Below is the graph of working length against buckling load for the first experiment. It is observed that as the working length was increasing, the buckling load was decreasing.
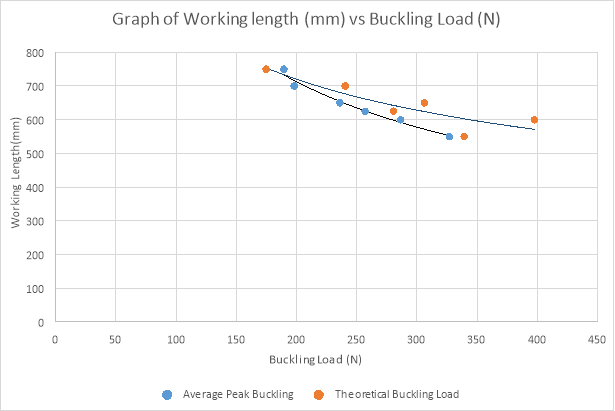
For the second experiment, A graph drawn for load against deflection shows a nonlinear relationship between the load applied and the deflection of the beam. The second graph is of deflection(y) against (y/P) where P is the load. This is the Southwell plot for the beam used.
A line of best fit drawn in the Southwell Plot indicates that the points obtained are having an almost linear relationship except at low values of deflection which has a small curvature. The slopes of the graphs, Euler buckling load, were obtained for different eccentricities together with the points of intersection with the y axis which indicates the eccentricity of loading. This represents the imperfection of the strut and the equipment used plus the imposed eccentricity.
Southwell plot results
|
Eccentricity (mm) |
Gradient |
y-intercept |
|
0 |
178.18 |
-1.301 |
|
5 |
164.32 |
-5.0783 |
|
7.5 |
170.12 |
-9.6389 |
Southwell plot;
The experiment was a success as the strut was subjected to different loads to determine the buckling load. The effect of material, length of the specimen, shape and fixing conditions were observed. Different graphs were drawn from the results obtained which enhanced further analysis. The Southwell graph was also drawn which was used to obtain eccentricity values and the struts theoretical/Euler buckling load.
- Wang, C.M., Zhang, Y.Y., Ramesh, S.S. and Kitipornchai, S., 2006. Buckling analysis of micro-and nano-rods/tubes based on nonlocal Timoshenko beam theory. Journal of Physics D: Applied Physics, 39(17), p.3904.
- Akgöz, B. and Civalek, -., 2011. Strain gradient elasticity and modified couple stress models for buckling analysis of axially loaded micro-scaled beams. International Journal of Engineering Science, 49(11), pp.1268-1280.
- Roorda, J., 1967. Some thoughts on the Southwell plot. Journal of the Engineering Mechanics Division, 93(6), pp.37-48.
- Mandal, P. and Calladine, C.R., 2002. Lateral-torsional buckling of beams and the Southwell plot. International Journal of Mechanical Sciences, 44(12), pp.2557-2571.
- Singer, J., 1989. On the applicability of the Southwell plot to plastic buckling. Experimental Mechanics, 29(2), pp.205-208.
- Cowper, G.R., 1966, June. The shear coefficient in Timoshenko’s beam theory. ASME.
Cite This Work
To export a reference to this article please select a referencing stye below:
Related Services
View all


DMCA / Removal Request
If you are the original writer of this essay and no longer wish to have your work published on UKEssays.com then please click the following link to email our support team:
Request essay removal