Performance Analysis for AD-HEED and N-HEED
| ✅ Paper Type: Free Essay | ✅ Subject: Computer Science |
| ✅ Wordcount: 3051 words | ✅ Published: 26 Mar 2018 |
4.1 Results and Discussion
In this section, we exhibit and discuss the results of the simulation. This section shows the performance analysis for AD-HEED and N-HEED compared to the original HEED protocol. Every result presented is the average of five experiments. The following sections give a detailed description of the experiments and the results.
4.4.1 Network Lifetime
The number of alive nodes for each round is observed for AD-HEED and N-HEED compared to HEED protocol to evaluate the lifetime of the network. In the proposed methods and according to the distance between the CH and its anchor, we proposed AD-HEED30, AD-HEED87, N-HEED30 and N-HEED87. 30 and 87 are the distance between the CH and its anchor (dch_to_Anc) where 30 is the cluster radius and 87 is the threshold distance which depends on the environment. According to simulation results, AD-HEED87 and N-HEED87 have the same results for all experiments so N-HEED87 results will not be appeared in any figure.
In all of the experiments, the sensor nodes were deployed uniformly. Figure 4‑1 shows the performance of HEED protocol compared to AD-HEED and N-HEED. It is observed that AD-HEED87 outperforms HEED and the other proposed methods. AD-HEED87 increases the network lifetime until all nodes consume their whole energy by more than 150 rounds compared with HEED protocol. N-HEED30 also increases the network lifetime by more than 50 rounds until the whole nodes die.
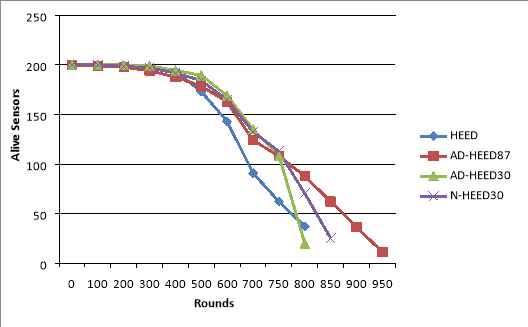
Figure 4‑1: Number of alive nodes per rounds
Figure 4‑2 presents how AD-HEED and N-HEED behave with HEED protocol in term of node death percentage. The figure below shows the number of rounds for 10%, 25%, 50%, 75% and 90% of nodes that consume their whole energy. The results show that AD-HEED and N-HEED outperform HEED throughout the network. There is a slight advantage to HEED on AD-HEED30 in 90% of nodes death .The figure shows that for 10% of nodes death, the best choice is AD-HEED30 and N-HEED30 while the best choice for 75% and 90% of nodes death is AD-HEED87. For 25% and 50% of nodes death the best choice occurs with all proposed methods because they are approximately the same. According to both of figures, the results show that our proposed methods outperform HEED.
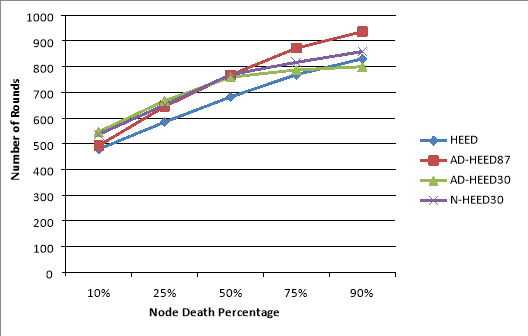
Figure 4‑2: Node death percentage per rounds
4.4.2 Energy Consumption Analysis
The performance of AD-HEED and N-HEED is compared with that of HEED protocol in term of energy consumption for data transmission between CHs and the base station. Figure 4‑3 reveals the ratio of energy consumption for AD-HEED and N-HEED per rounds compared with HEED. Here, the energy consumption is the energy consumed by nodes to transmit data to the base station. According to the listed parameters, the results show that the energy consumption for data transmission between CHs and the base station is approximately 19% from the whole energy in HEED protocol. According to our experiments, we have a network that consists of 200 sensors deployed in 100m × 100m, the base station located away at (200, 200) from the surrounding area and the initial energy for each node is 2 J. The total energy for 200 nodes is 400 J and then the energy consumed to transmit data from CHs to the base station is 76 J (19% of 400 J). The figure below shows that AD-HEED87 is the lowest energy consuming and then N-HEED30 and AD-HEED30 respectively which means that all of them consumed energy lower than that consumed by HEED. AD-HEED87 decreases the energy consumption by HEED by almost 47% and this means it consumes 36 J for data transmission.
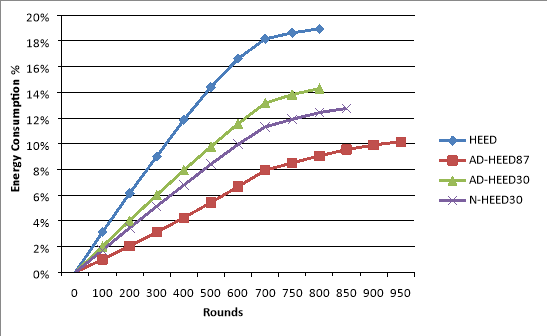
Figure 4‑3: The ratio of energy consumption per rounds
Figure 4‑4 presents the ratio of energy consumption in data transmission in term of node death percentage. The figure below shows the ratio of energy consumption for 10%, 25%, 50%, 75% and 90% of nodes that consume their whole energy. As it is obviously clear from the figure, AD-HEED and N-HEED consume lower energy than HEED throughout the network. AD-HEED87, N-HEED30 and AD-HEED30 are the lowest energy consumption respectively.
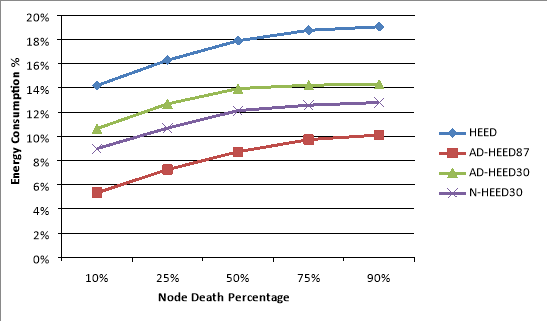
Figure 4‑4: The ratio of energy consumption for AD-HEED, N-HEED and HEED
Table 4‑2 reveals the improvement of energy consumed for data transmission of AD-HEED and N-HEED on HEED protocol for 10%, 25%, 50%, 75% and 90% of nodes death. The comparison results shown in Table 4‑2 depict that AD-HEED87, N-HEED and AD-HEED30 respectively are more energy efficient than HEED throughout the network. It is worth mentioning here that the data transmission energy is the energy consumed to transmit data from CHs to the base station.
Table 4‑2: Improvement of AD-HEED and N-HEED on HEED protocol
|
Node Death Percentage |
Improvement on HEED |
||
|
AD-HEED87 |
N-HEED30 |
AD-HEED30 |
|
|
10% |
62.41% |
36.72% |
25.08% |
|
25% |
55.49% |
34.43% |
22.15% |
|
50% |
51.26% |
32.26% |
22.09% |
|
75% |
48.17% |
32.98% |
24.16% |
|
90% |
46.95% |
32.84% |
24.94% |
4.4.3 Variance of the Base Station Location
In this set of experiments we evaluate how varying the location of the base station could effect on both schemes; AD-HEED and N-HEED in term of network lifetime and energy consumption. Figure 4‑5 compares the lifetime of the network of AD-HEED and N-HEED with HEED, where the network lifetime is the time until the first 10% of nodes die and when the locations of the base station are (150, 150), (200, 200) and (250, 250) on x-coordinate and y-coordinate. Similar comparisons are conducted for the network lifetime in term of HND and LNA10% as exhibited in Figure 4‑6 and Figure 4‑7 respectively. Both approaches improve the network lifetime with different locations for the base station compared to HEED protocol. Figure 4‑5 shows that AD-HEED30 is the best choice where the network lifetime is FND10%.
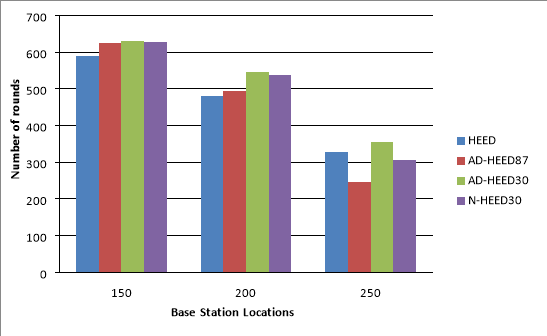
Figure 4‑5: Comparing HEED with AD-HEED and N-HEED using different locations of the base station for FND10% metric
Figure 4‑6 and Figure 4‑7 show that AD-HEED87 and N-HEED30 prolong network lifetime in term of HND and LNA10% while AD-HEED30 prolongs network lifetime in term of HND and LNA10% while AD-HEED30 prolongs network lifetime in term of HND. Thus, for the application that requires that at least 90% of nodes should work, AD-HEED30 is the best choice and appropriate for improving the network lifetime in term of FND10%. If the demand of the application is to boost the lifespan of the network in term of LNA10%, then AD-HEED87 will be appropriate because they improve the network lifetime in term of LNA10% significantly.
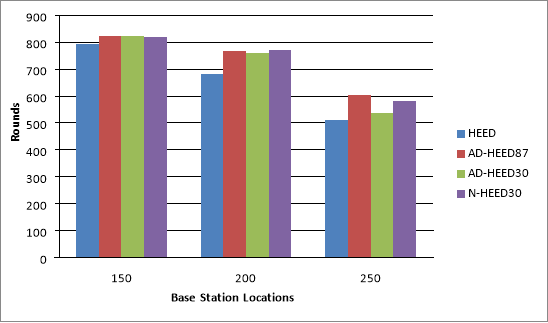
Figure 4‑6: Comparing HEED with AD-HEED and N-HEED using different locations of the base station for HND metric
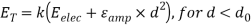
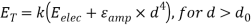
It can be easily observed form Figure 4‑5, Figure 4‑6 and Figure 4‑7 that if the base station location is farther, the network lifetime will decrease in term of FND10%, HND and LNA10% in AD-HEED and N-HEED. The decreasing of network lifetime is due to consuming more energy to transmit data to the base station. We know that the anchor or CH consumes (k (Eelec + Eamp * dn)) J to transmit k-bit message to the base station where n = 2 for d < d0, and n = 4 for d ≥ d0. Thus, the distance between the closest node and the base station according to the experiments is greater than 87 (d0) so n = 4 all the time. In other words, whenever the base station was nearer, CHs and anchors will consume less energy to deliver data to the base station and vice versa. This means that the distance between CHs or anchors and the base station is a critical factor which effects on the energy consumption.
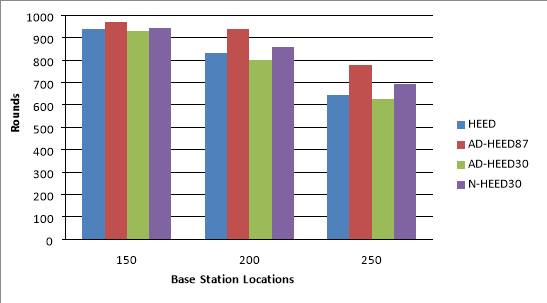
Figure 4‑7: Comparing HEED with AD-HEED and N-HEED using different locations of the base station for LNA10% metric
The following three figures present the energy consumed in Joules by HEED, AD-HEED and N-HEED using different locations of the base station. From the figures, it is clear that AD-HEED and N-HEED consume less energy than HEED protocol throughout the network. The energy saving by the proposed method increases as the location of the base station was farther. The explanation of this was aforementioned. It is clear from the figures that the fraction of improvement decreases as we go through the network lifetime. In other words, the fraction of improvement in the energy consumption for FND10% is greater than that for HND and LNA10%. This is due to that in the earlier periods of the network lifetime there are a lot of nodes that not consume their whole energy. Thus, CHs can select the beast node as anchor which is the closest node to the base station. But in the in the later periods of the network lifetime, a lot of nodes die. Thus, some of CHs may not use anchor to transmit data the base station or select a node as anchor which not effect on energy consumption impressively. Figure 4‑8, Figure 4‑9 and Figure 4‑10 reveal that AD-HEED87 is the most energy saving and then N-HEED30 and AD-HEED30.
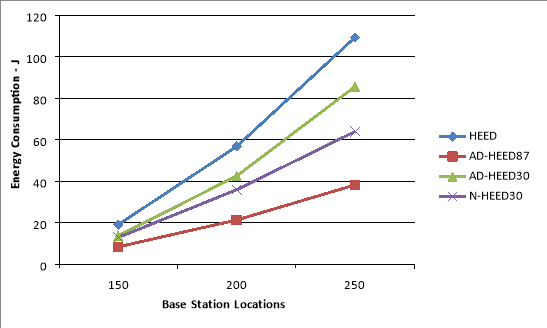
Figure 4‑8: The energy consumption using different locations of the base station for FND10% metric
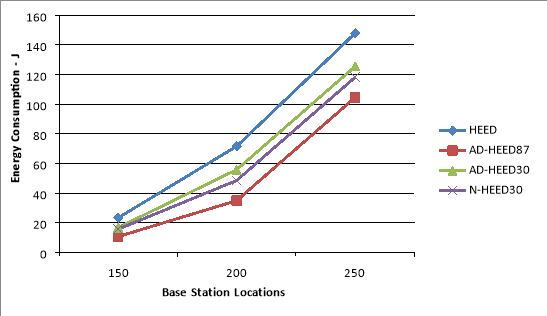
Figure 4‑9: The energy consumption using different locations of the base station for HND
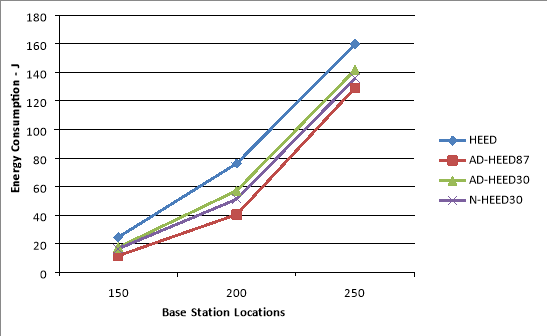
Figure 4‑10: The energy consumption using different locations of the base station for LNA10% metric
4.4.4 Variance of the Number of Sensors
We also evaluate the effectiveness of increasing number of the nodes on both methods; AD-HEED and N-HEED. Figure 4‑11 compares the lifetime of the network of HEED to AD-HEED and N-HEED, where the network lifetime is FND10% and when the number of nodes is varied between 150, 200, 250 and 300 nodes. Identical comparisons are conducted for HND and LNA10% as depicted in Figure 4‑12 and Figure 4‑13 respectively. Both methods improve the network lifetime as the number of nodes increases. The figures show that, in almost all cases, AD-HEED and N-HEED performs better than HEED. This improvement is also due to using the anchor as intermediate between CHs and the base station. This increases the network lifespan and decreases the energy consumption. The figures show that AD-HEED30 outperforms the others in term of FND10% while AD-HEED87 outperforms the other in term of LNA10% as the number of sensors increases. AD-HEED87 and N-HEED30 are approximately the same with a slight advantage to AD-HEED87 in term of HND.
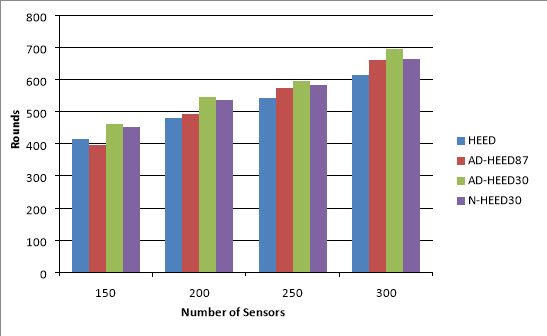
Figure 4‑11: Comparing HEED with AD-HEED and N-HEED using different number of sensors for FND10% metric
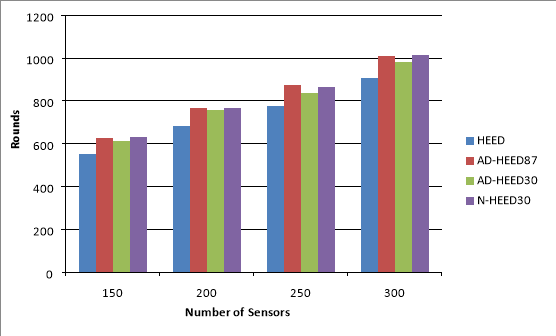
Figure 4‑12: Comparing HEED with AD-HEED and N-HEED using different number of sensors for HND metric
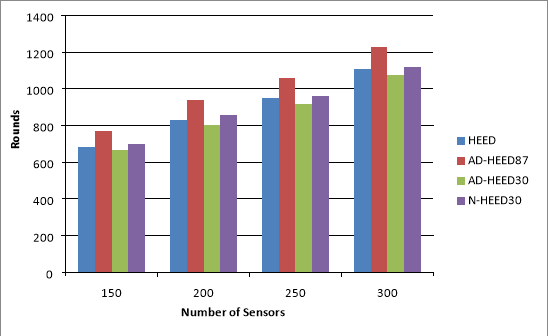
Figure 4‑13: Comparing HEED with AD-HEED and N-HEED using different number of sensors for LNA10% metric
The following three figures present the energy consumed in Joules by HEED, AD-HEED and N-HEED using different number of sensors.
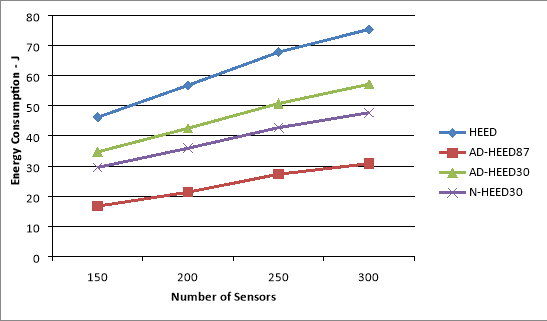
Figure 4‑14: The energy consumption using different number of sensors for FND10% metric
It is obviously clear that AD-HEED and N-HEED are more energy efficient because they consume less energy than HEED protocol in all experiments throughout the network. It can be easily observed form the figures that the percentage of improvement is almost the same when the number of the nodes increases. So, the proposed methods doesn’t affect by varying the number of sensors.
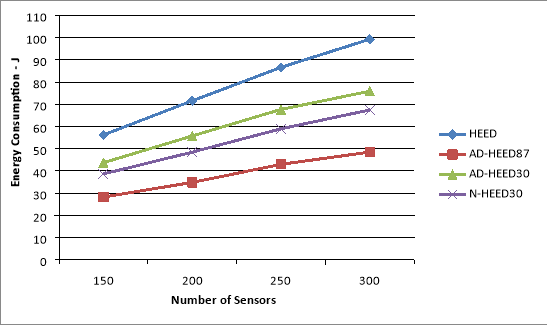
Figure 4‑15: The energy consumption using different number of sensors for HND metric
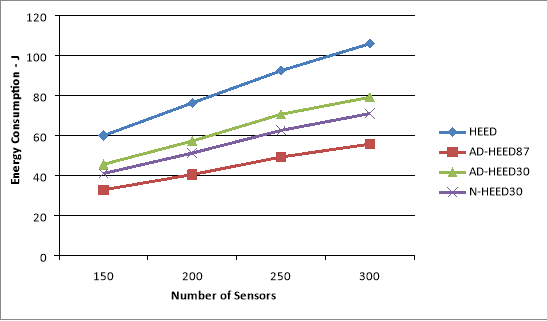
Figure 4‑16: The energy consumption using different number of sensors for LNA10%
4.4.5 Results Analysis
In HEED protocol, each sensor gathers data and forwards it to its CH. CHs in turn aggregate data from sensors and transmit it to the base station which located far away from the surrounding area. CHs consume their energy during data aggregation from sensors, data compression per signal and forwarding them to the base station.


Where ET is energy consumed for transmission of K bits for distance d, ER is energy consumed for receiving, Eelec is energy consumed by the sensor node circuit, Eamp is the energy consumed by amplifier and Efus is the energy consumed for data fusion.
Our proposed technique focuses on data transmission between CHs and the base station. The energy consumed by CH to transmit data to the base station directly (EnDir) represents a certain percentage of the whole energy. This percentage differs according to many factors such as the base station location, number of sensors and etc. the energy consumed for direct data transmission is calculated as the following:
EnDir = EnCH_to_BS
EnCH_to_BS = 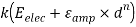
The energy consumed to transmit data to the base station indirectly via anchor (EnIndir) is calculated as the following:
EnIndir = EnCH_to_Anc + EnAnc_to_BS
EnCH_to_Anc = 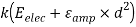 (1)
(1)
EnAnc_to_BS =  + (2)
+ (2)
Where n =2 if d < d0 or n = 4 if d > d0. The energy of (1) is consumed for transmission data to the anchor by CH while the energy of (2) is consumed for receiving data from CH and forwarding it to the base station by anchor.
In AD-HEED, CHs transmit the collected data to their anchors if EnDir > EnIndir and anchors in turn transmit data to the base station. Otherwise CHs transmit the gathered data to the base station directly.
In N-HEED and in addition to AD-HEED, the current anchors transmit the gathered data to the next anchors if EnDir > EnIndir and the next anchors in turn transmit data to the base station. Otherwise the current anchors transmit the gathered data to the base station directly.
Figure 4‑17shows the detailed description of how can transmitting data via anchors reduce the energy consumption. If we assume that the point a is the CH, d is the base station and b, c and e are hypothetical points that located in the CH’s transmission range which represented by a circle. The deployment field is 100m x 100m and the base station located away at (200, 200) m from the network field. The transmission range is 30 (cluster radius). ac = ab = 30. ad is the distance between CH and the base station while bd, cd and ed are the distances between the points b, c and e respectively and the base station. According to our proposed technique, CH selects the closest sensor to the base station to be its anchor and it should be closer than CH itself. Firstly, we assume that the distance between the base station (d) and point (c) is equal to the distance between the base station and CH (a). After that, we reduce the distance cd by moving the position of point c and calculate the energy consumed to transmit one byte from CH (a) to the base station directly (EnDir) and the energy consumed to transmit one byte from CH to the base station indirectly (EnIndir) via point (c). This operation repeats many times until EnDir > EnIndir. The same operations are conducted with point (b). After testing and calculation and by assuming that c, b and e are sensors, we get that cd and bd are the maximum distances while ed is the minimum distance in which sending data to the base station indirectly via sensors c, b or e consumes less energy than sending data directly from CH to the base station. Now, we can see that for any sensor located in the gray zone in the circle and has a distance to the base station less than the maximum distance, transmitting data from CH to the base station via any of these sensors will consume less energy than energy consumed by transmitting data from CH directly to the base station.
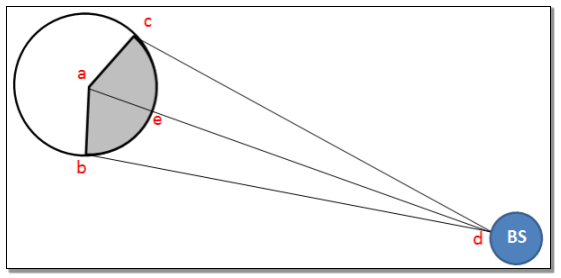
Figure 4‑17: The mechanism of sending data via anchors
Chapter Two: Conclusions and Future work
5.1 Conclusions
In this research, we proposed an efficient mechanism for hierarchal protocols of wireless sensor networks which proved to be more efficient in the use of energy than HEED protocol in most cases. The main contribution is to allow CHs to transmit data by using other sensors called anchors as intermediates which are closer to the base station than CHs. Furthermore, this approach reduces the burden from the CHs which consume their energy by collecting data from sensors and forwarding them to the base station. The sensor which has the collected data compares between the energy consumed in case if it transmits data directly to the base station and if it transmits data indirectly to the base station via its anchor. After that, the sensor decided either to transmit data directly or via anchors to the base station base on way that consumes less energy. We compared and evaluated the proposed approach performance with the HEED protocol in terms of network lifetime and energy consumption. Simulation results depict that the proposed methods which called AD-HEED and N-HEED perform better than HEED. The improvement percentage relies on the best choice of the distance between the CH and the anchor, the evaluation metrics and the properties of the wireless sensor network. This improvement is because of that the sensor consumes much less energy when they transmit data to sensor closer than another. We know that the CH consumes (k (Eelec + Eamp * dn)) J to transmit k-bit message to the base station. If the distance between CH and the base station less than threshold distance, the energy consumption equation is calculated by using distance to the power of 2 otherwise, to the power of 4. So, the energy consumption is decreased by using anchors
which allow sensors to transmit data via short distances until all data received by the base station. According to simulation results, the distance between CH and the base station is very critical factor which effects on the network lifetime and energy consumption .Furthermore; we also conduct a performance evaluation between our proposed approach and HEED protocol by using different number of sensors and different locations of the base station. The simulation results show that the variation in the number of sensors doesn’t affect significantly on the percentage of improvement. The simulation results show also that the percentage of improvement decreases as the location of the base station was farther because the sensors consume more energy whenever transmitting data over long distances.
5.2 Future Work
Though considerable effort has been made on this thesis, many ideas regarding the subject are still not investigated. This section outlines and presents some of our future plans to be conducted in order to improve this work.
The choosing of anchors in our approach depended entirely on the distance between the sensors and the base station where CHs choose the closest sensor to the base station. We think to make the choosing of anchors more controlled by taking into account different conditions and other related parameters such as the residual energy, the positions of the nodes and the received signal strength.
The collected data by sensors is transmitted by CHs to one base station. This assumption is similar to that in HEED protocol. For scenarios where there are more than one base station located in different locations, each CH should transmit data to the suitable base station. Thus, studying how our proposed approach behaves with these scenarios is a very good idea to be conducted for future work.
Finally, the energy consumption and network lifetime are the only performance metrics that are used to evaluate our proposed approach. Using other performance metrics such as throughput, latency and packet delivery ratio to evaluate the proposed approach is a good idea to be conducted for future work.
Cite This Work
To export a reference to this article please select a referencing stye below:
Related Services
View all


DMCA / Removal Request
If you are the original writer of this essay and no longer wish to have your work published on UKEssays.com then please click the following link to email our support team:
Request essay removal